Julius AI Review 2026: Is It the Best AI Data Analyst?

Julius AI is an advanced data analysis tool that understands and transforms your raw data into something you can understand.
I’m talking about data handling, analysis, and visualization. The kind of stuff that usually requires a computer science degree.
The best part? You don’t need to know any of the technical stuff.
If you can use ChatGPT, you can use Julius AI. It’s built for regular people, not data scientists.
But here’s what’s changed since I first reviewed it. Julius AI isn’t just a chat-with-your-data tool anymore. It’s become something much bigger.
They’ve added features that turn it into a complete data workspace.
I’m talking about Notebooks that let you build repeatable analysis workflows, Data Connectors that plug directly into your databases, and a Data Explorer that shows you exactly what’s happening under the hood.
Let me show you what I mean.
JULIUS AI REVIEW SUMMARY
Julius AI has evolved from a data analysis tool into a complete data platform. You can connect directly to databases, build reusable analysis workflows with Notebooks, create professional visualizations with Chart Themes, and automate reports. The natural language interface makes advanced data analysis accessible to anyone.
Free plan, paid plan starts at $20/month
(Use coupon code DHRUVIR to get a flat 10% discount on your first payment)
What is Julius AI?
Julius AI is a powerful data analyst, a generative AI answer engine, and a research assistant that enables you to do magical stuff with your data. Or without it.
The core idea is simple: you chat with your files (PDF, image, CSV, Google Sheets, whatever) and extract insights from them using plain English.
But Julius AI has evolved way beyond just file uploads.
You can now connect it directly to your databases, build repeatable analysis workflows, and even schedule automated reports. More on that later.
The versatility is what gets me.
You can do everything from basic PDF summarization to complex statistical analysis. Create charts and graphs (interactive and animated ones too) and download them with a click.
Julius understands Python and R deeply. Which means if Python or R can do it, Julius probably can too.
Here’s what’s changed since I first reviewed it: Julius now has access to the latest AI models:
It can access the internet too, which means current information and real-time data.
The Advanced Reasoning feature is more powerful now. Turn it on and Julius creates a step-by-step plan before diving into analysis. Think of it as Julius thinking out loud before acting.
But the biggest change?
Julius isn’t just a chat tool anymore. It’s becoming a complete data platform with features like:
These additions transform Julius from “smart data assistant” to “data infrastructure you can actually use.”
Getting Started with Julius AI
Using Julius AI is easy.
Head over to Julius AI’s homepage and click the Start a Chat button to create a free account.
Once you log in, you will land on this page. It’s Julius AI’s main dashboard.
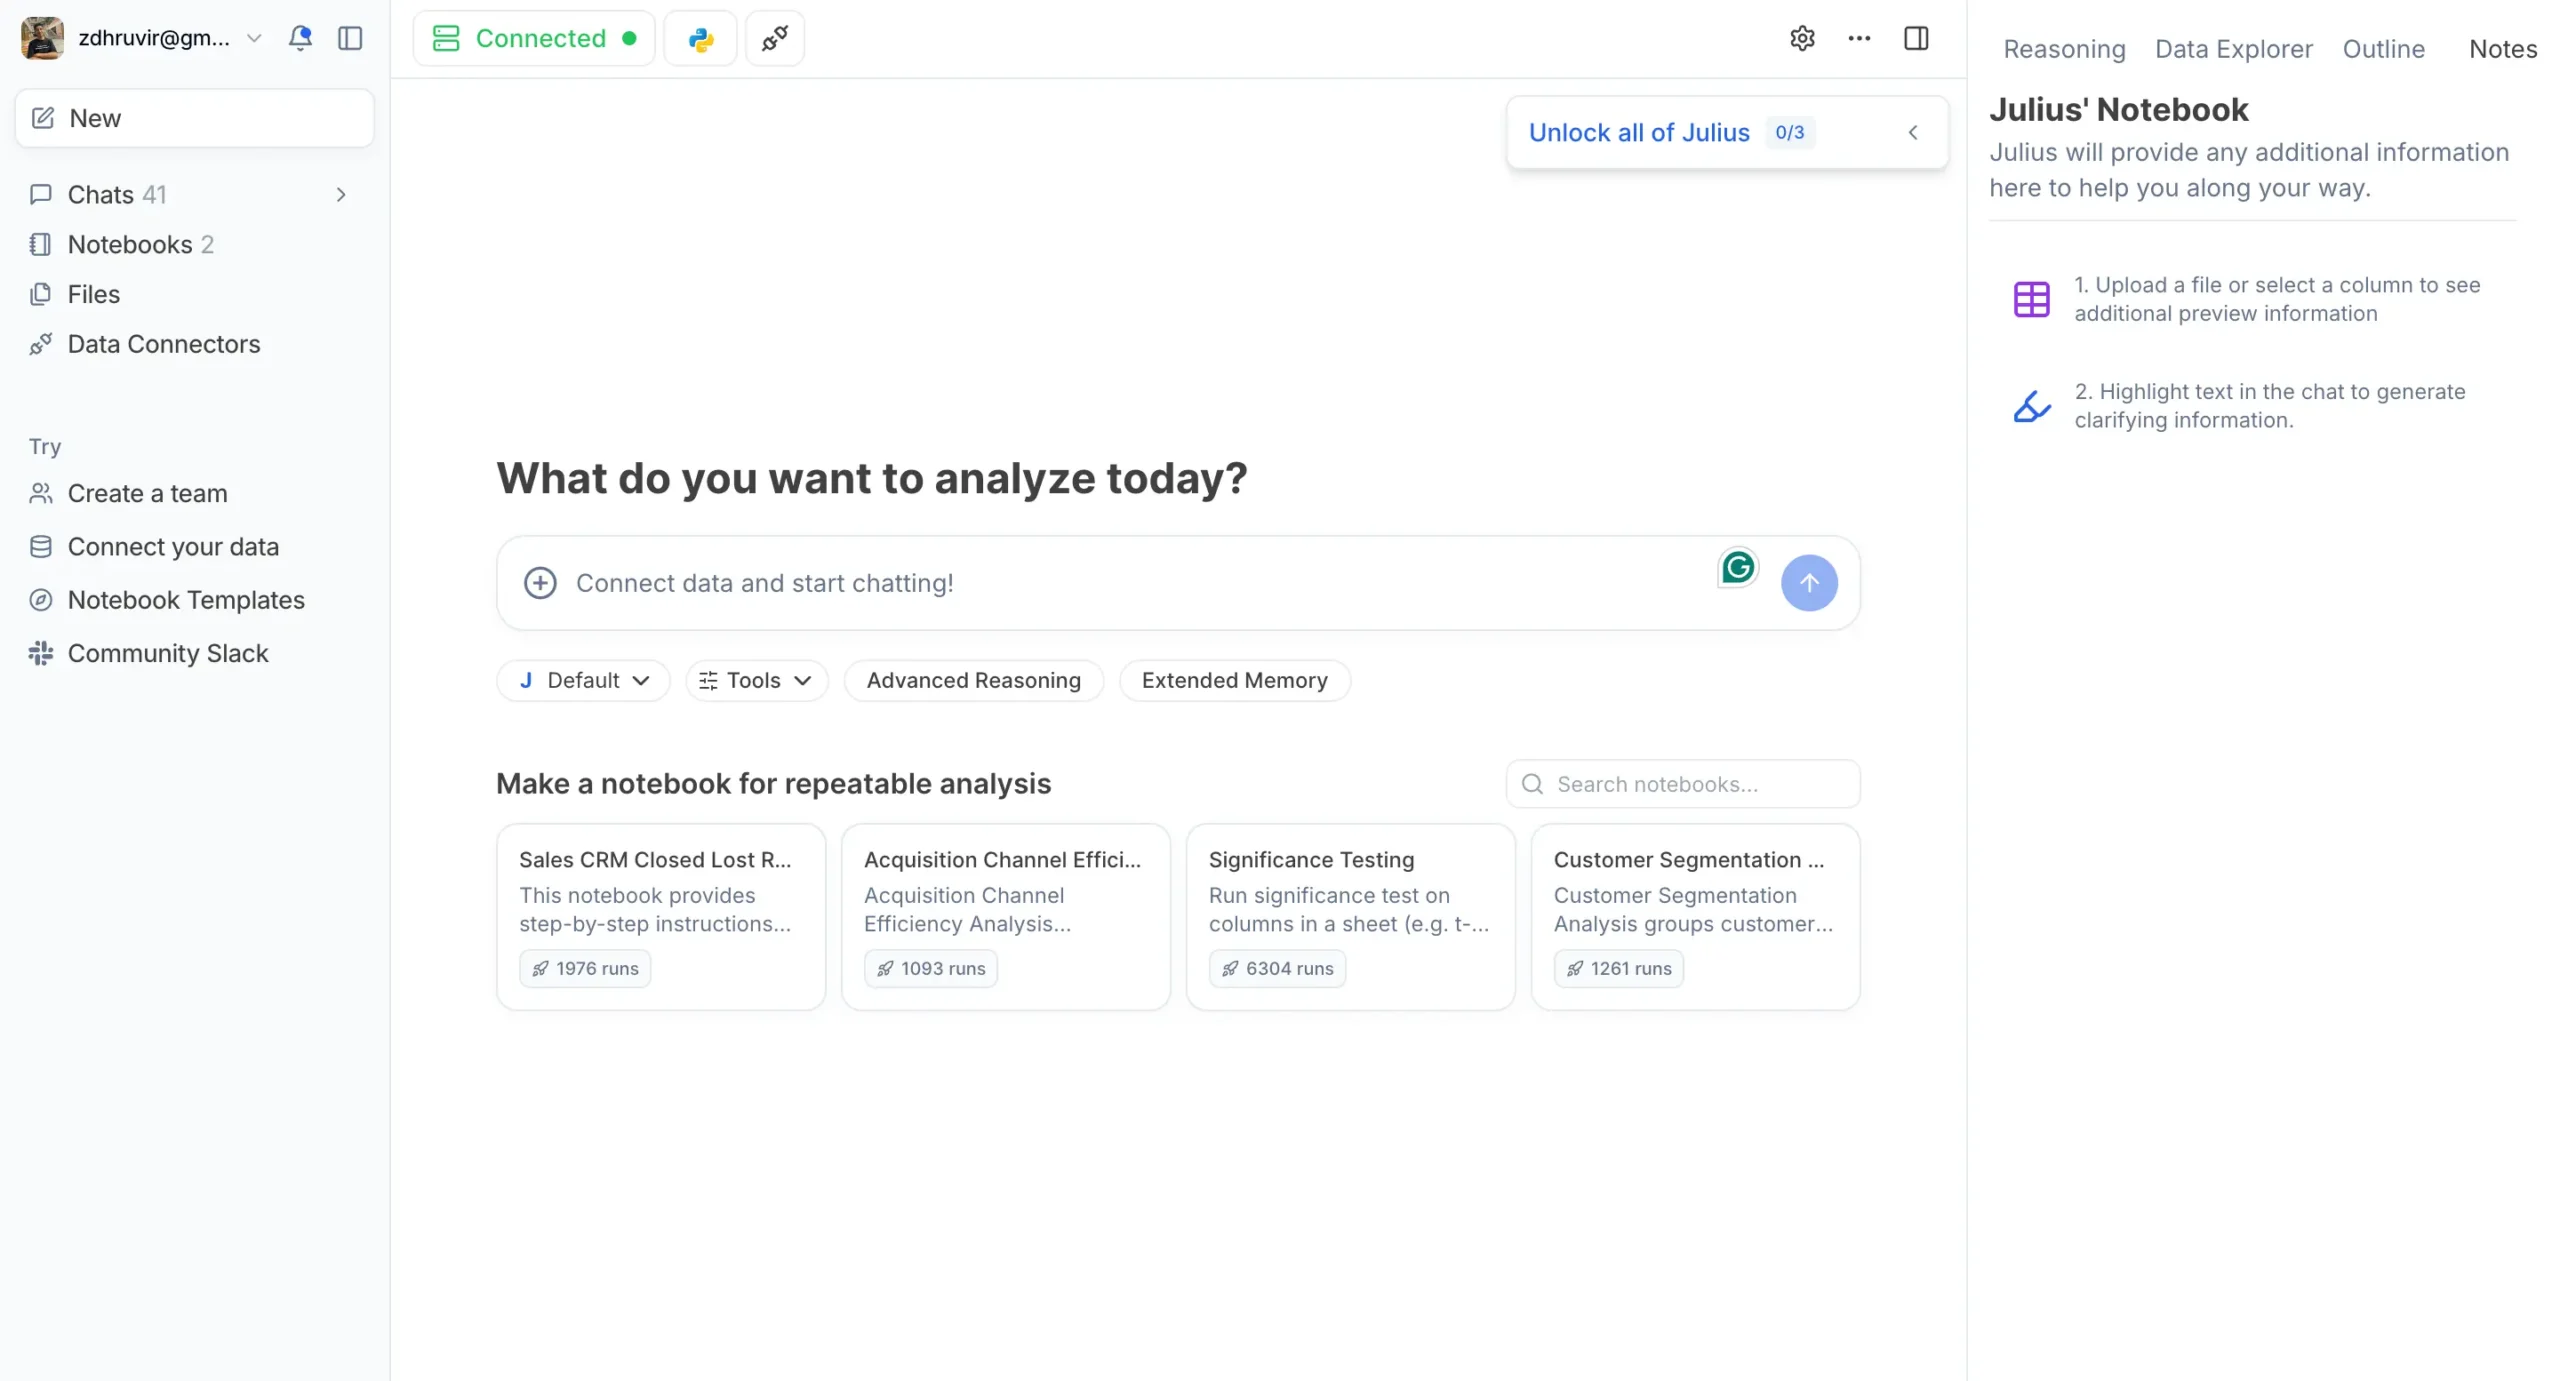
It’s clean and minimal, with a left sidebar that can be collapsed for a further minimal look.
All the conversations will take place on the chat container.
Let’s look at what Julius AI can do for you, one use case at a time.
Data Handling and Analysis
Julius AI can do a lot for your data. But here’s what’s changed: you’re not limited to uploading files anymore.
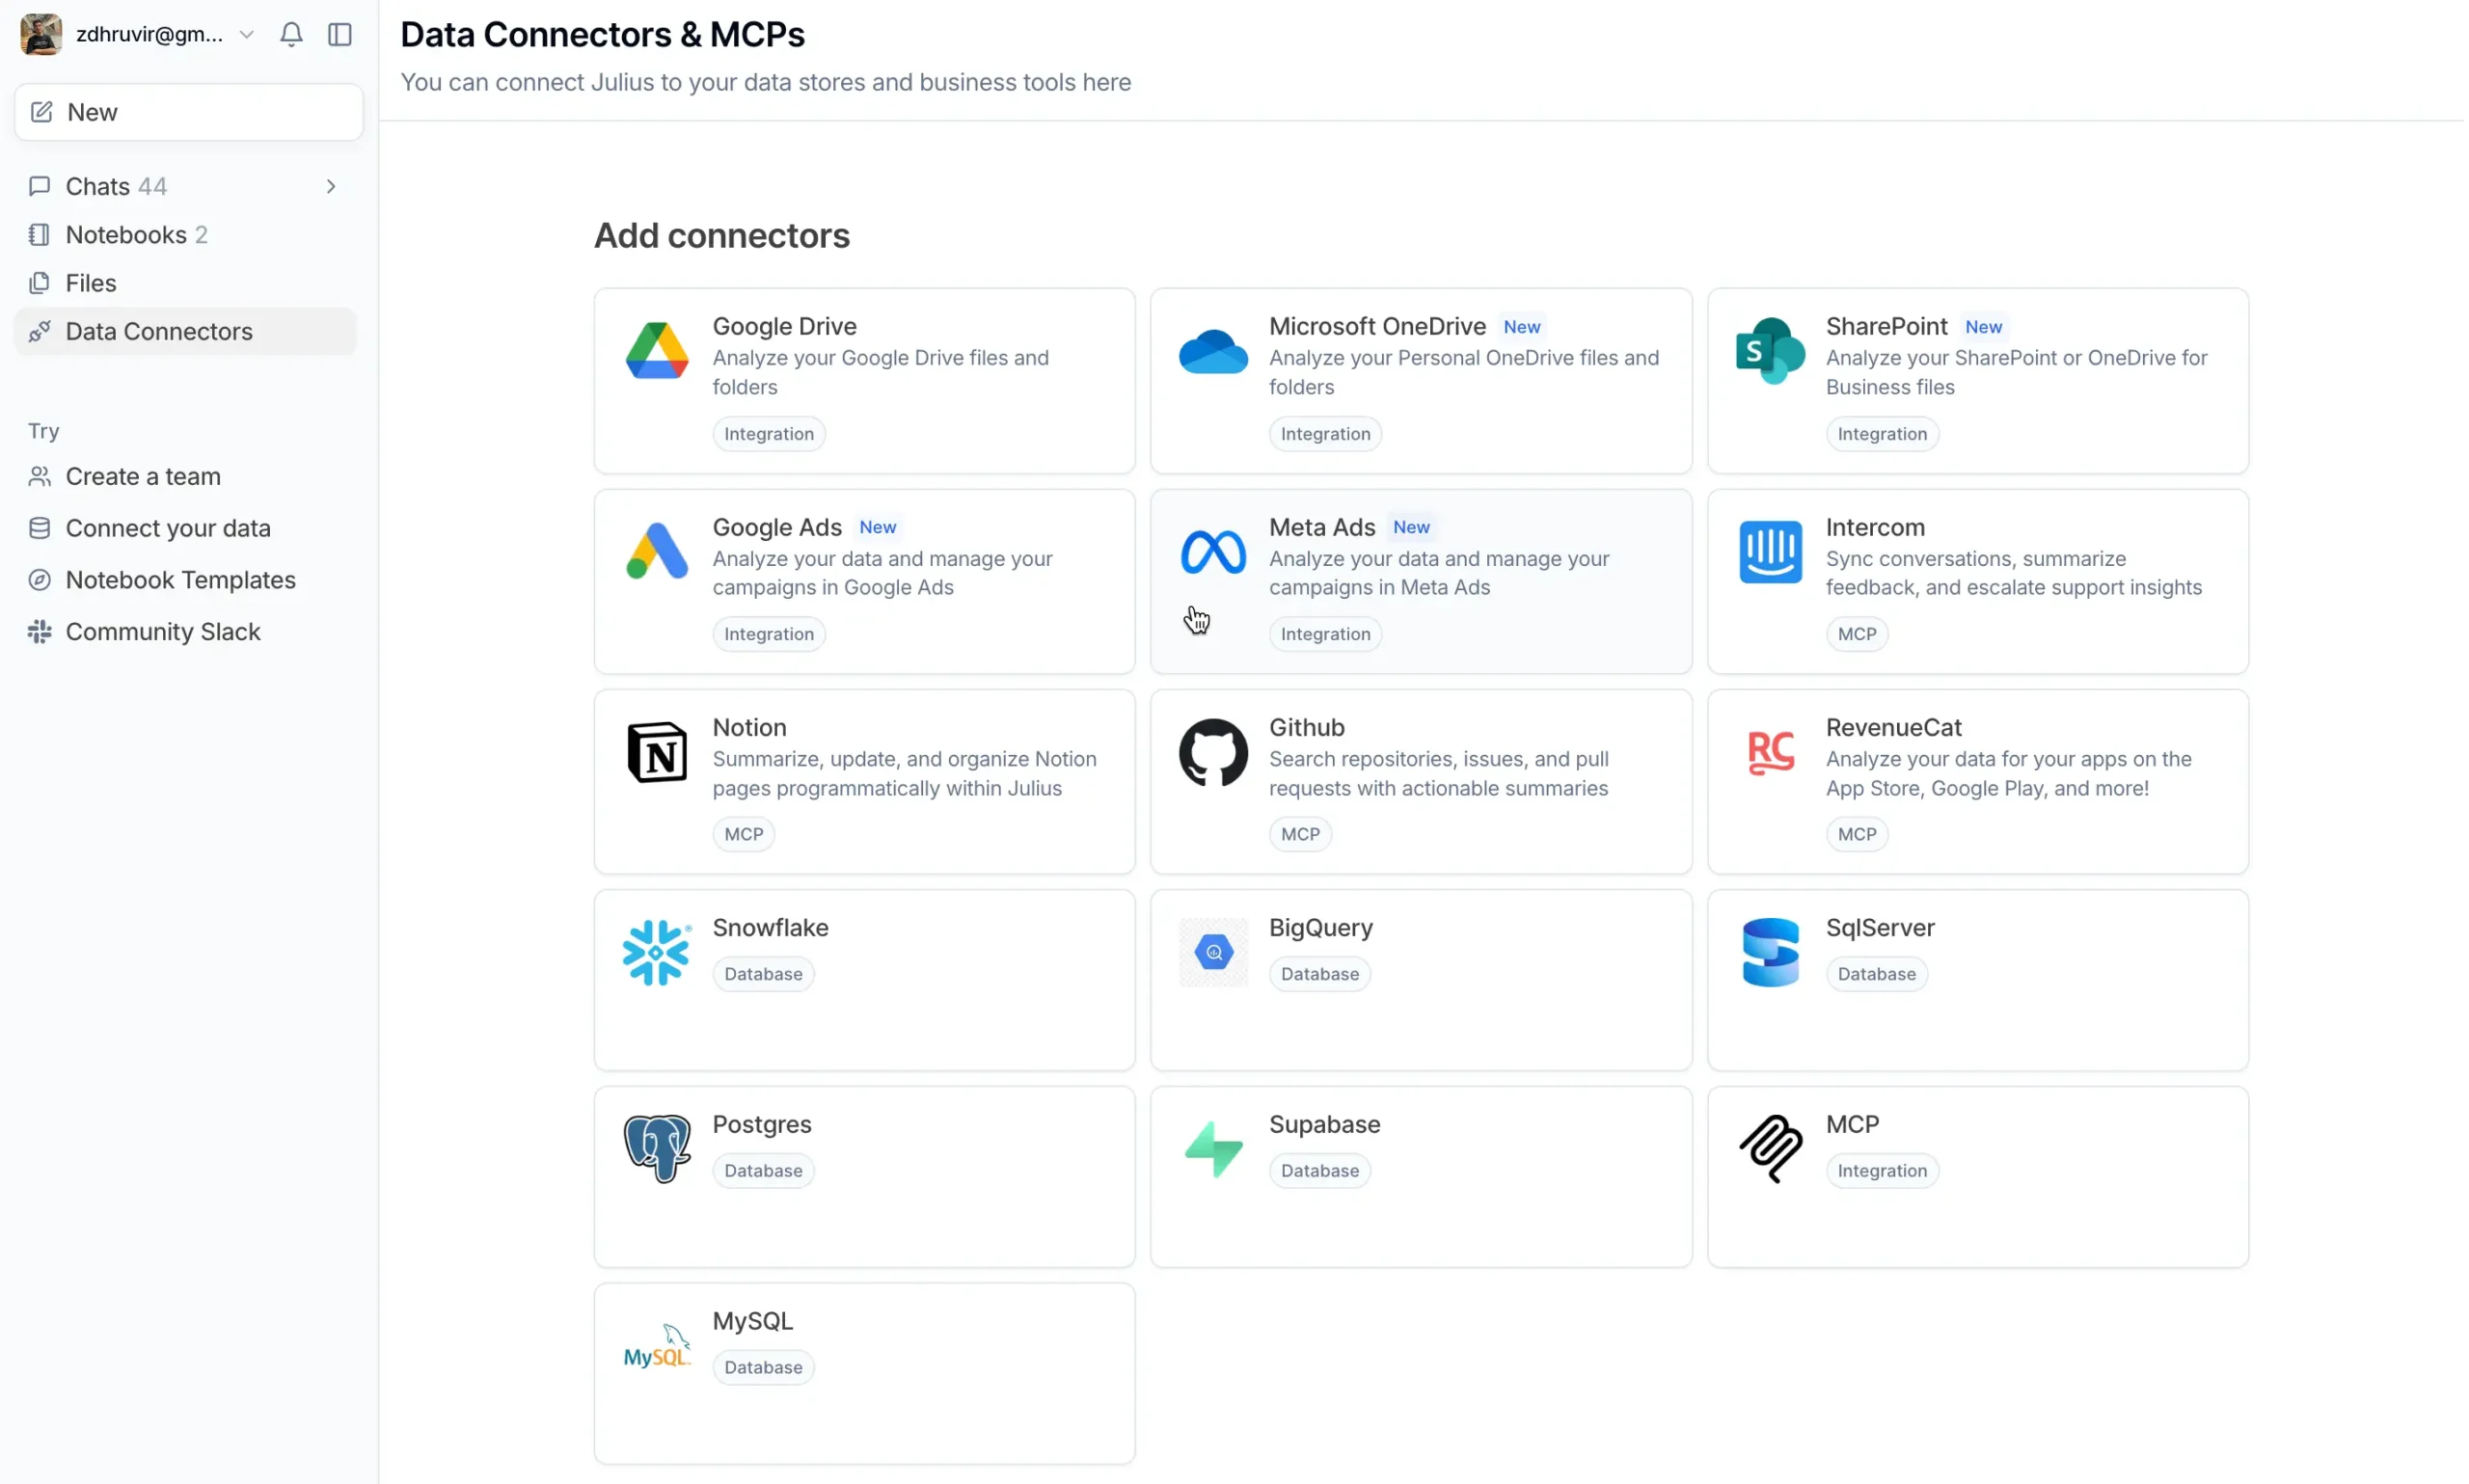
You can now connect Julius directly to your databases – PostgreSQL, BigQuery, Snowflake, whatever you’re using.
We’ll cover Data Connectors in detail later, but for now, let’s start with the traditional approach: file uploads.
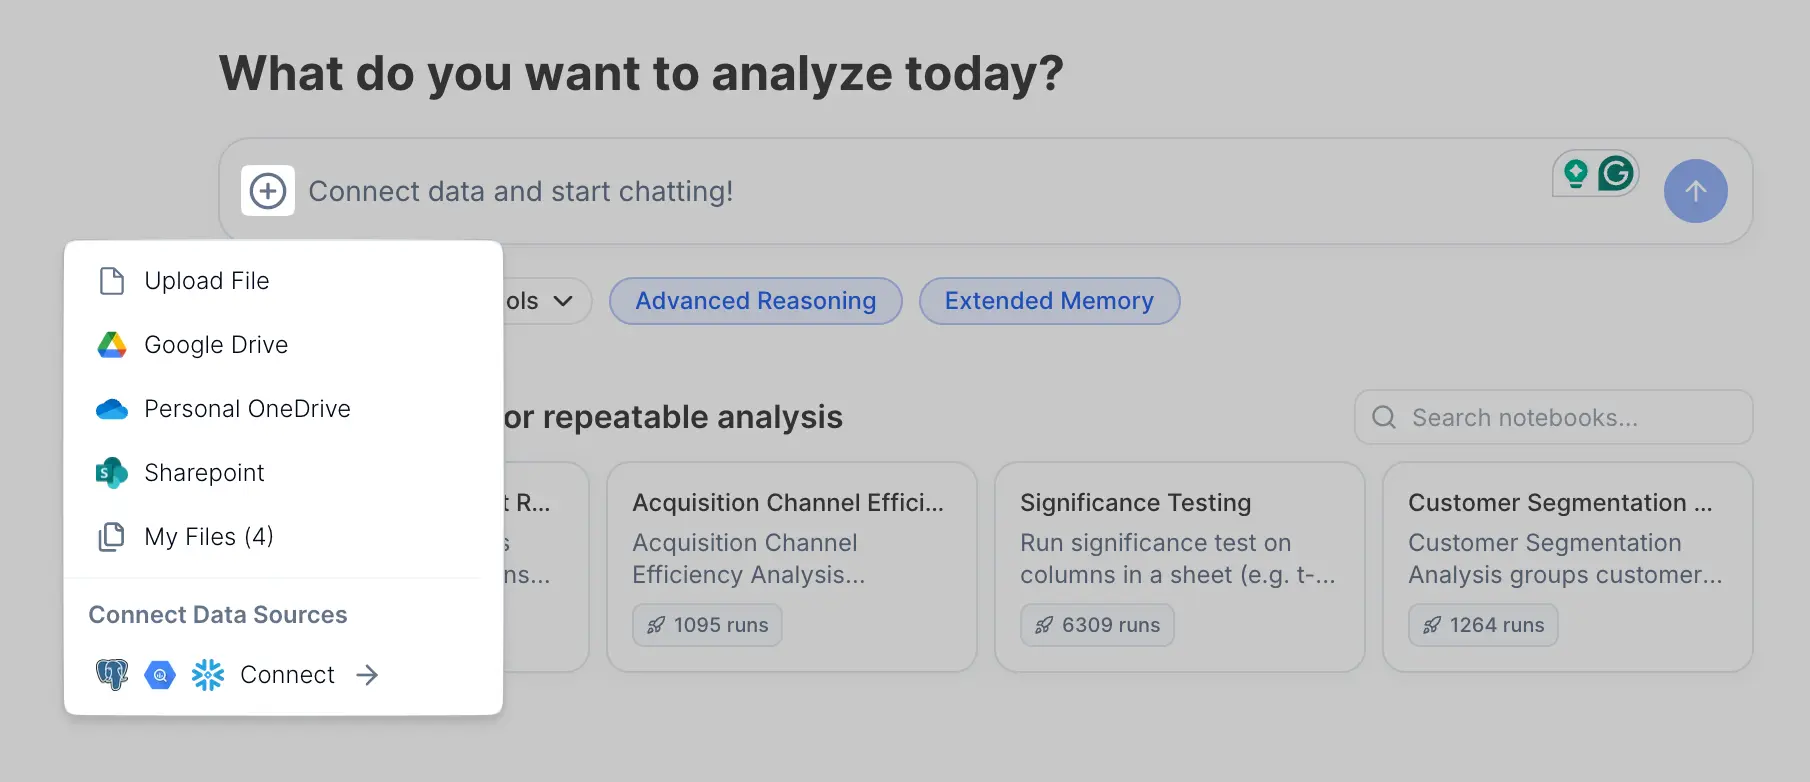
Click the plus button and you’ll see file upload options. Choose from different file types, or if you’ve set up Data Connectors, you can pull from those too.
Once your file uploads, it becomes visible. If it’s a spreadsheet, you can see the content right there in the interface.
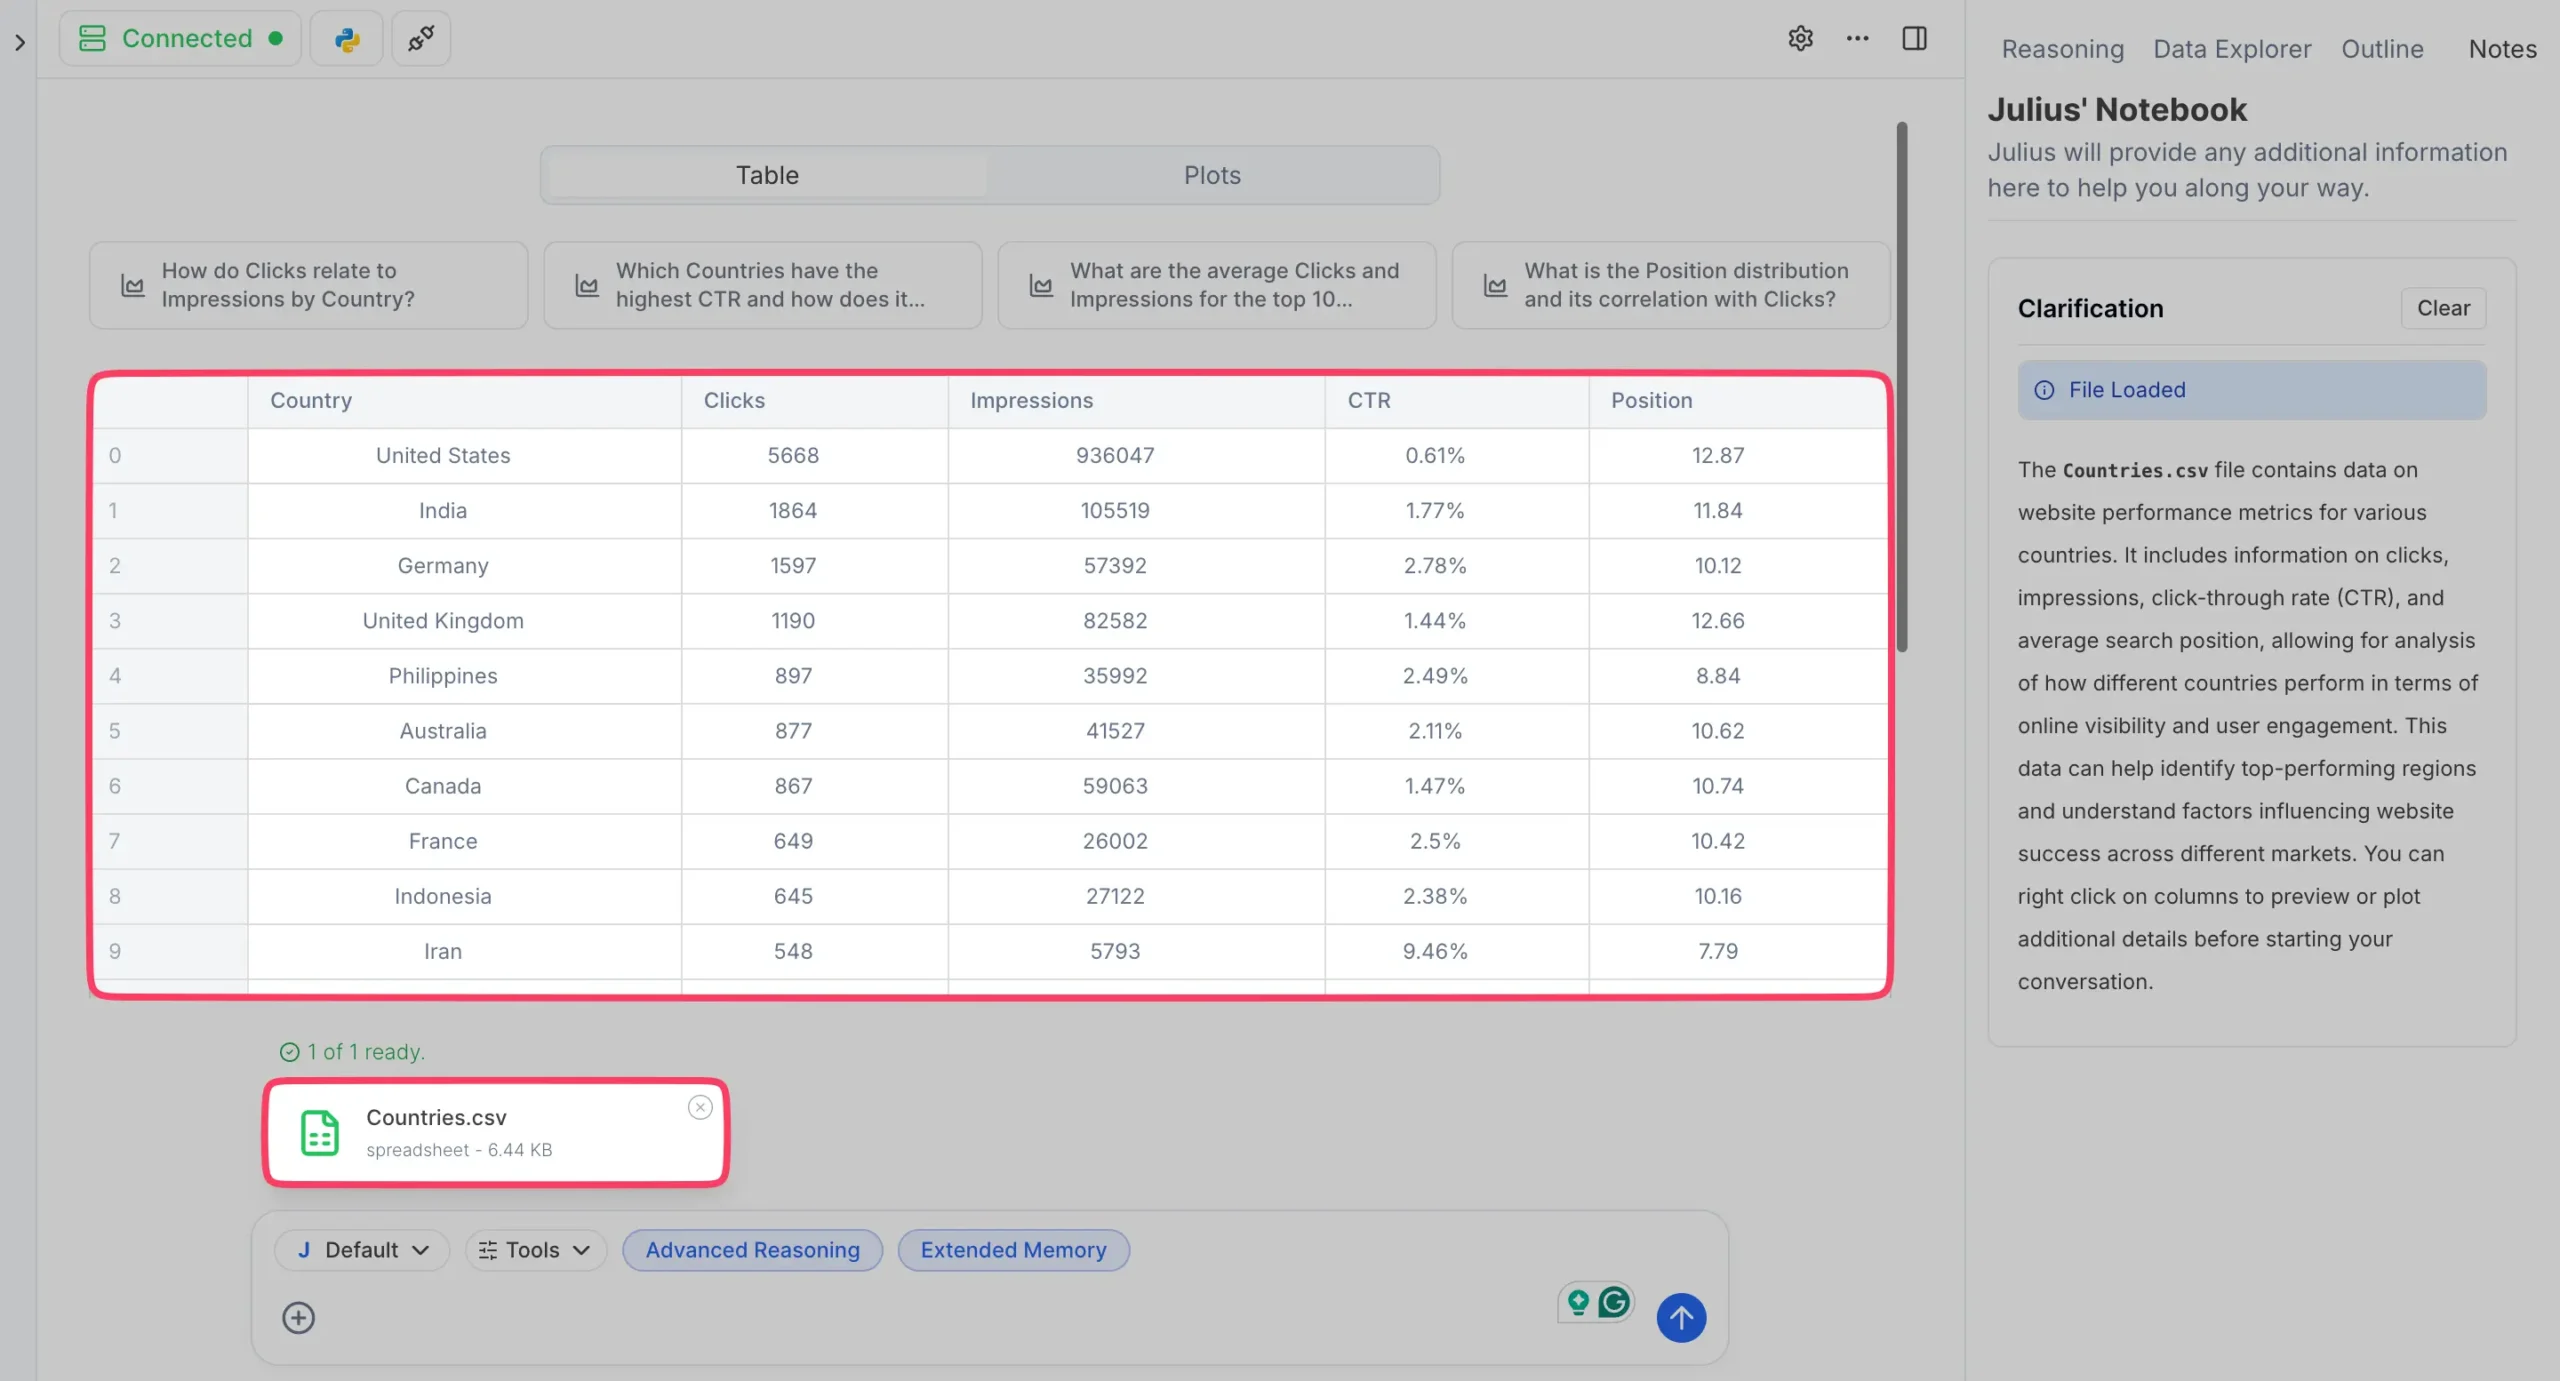
Here’s something clever: you can drag and select specific parts of the spreadsheet if you want Julius to focus on just a subset of your data. By default, Julius reads everything, but sometimes you only care about certain columns or rows.
For this example, I’m using a Google Sheets dataset with:
I exported this from my Google Search Console account and uploaded it to Julius.
Important note: Uploaded files get deleted from their servers after an hour. They do this for security, but it means you can’t build long-term workflows around uploaded files. That’s where Data Connectors become essential – they let you work with live data that doesn’t disappear.
Julius handles multiple files simultaneously too. Upload your sales data, customer data, and marketing data all at once, then ask questions that span across all of them.
Pro tip: Need sample data to experiment with? Head to Google Datasets or Kaggle Datasets for free datasets on any topic.
Configuring Your Analysis
Once you upload data, you have several options before diving into analysis.
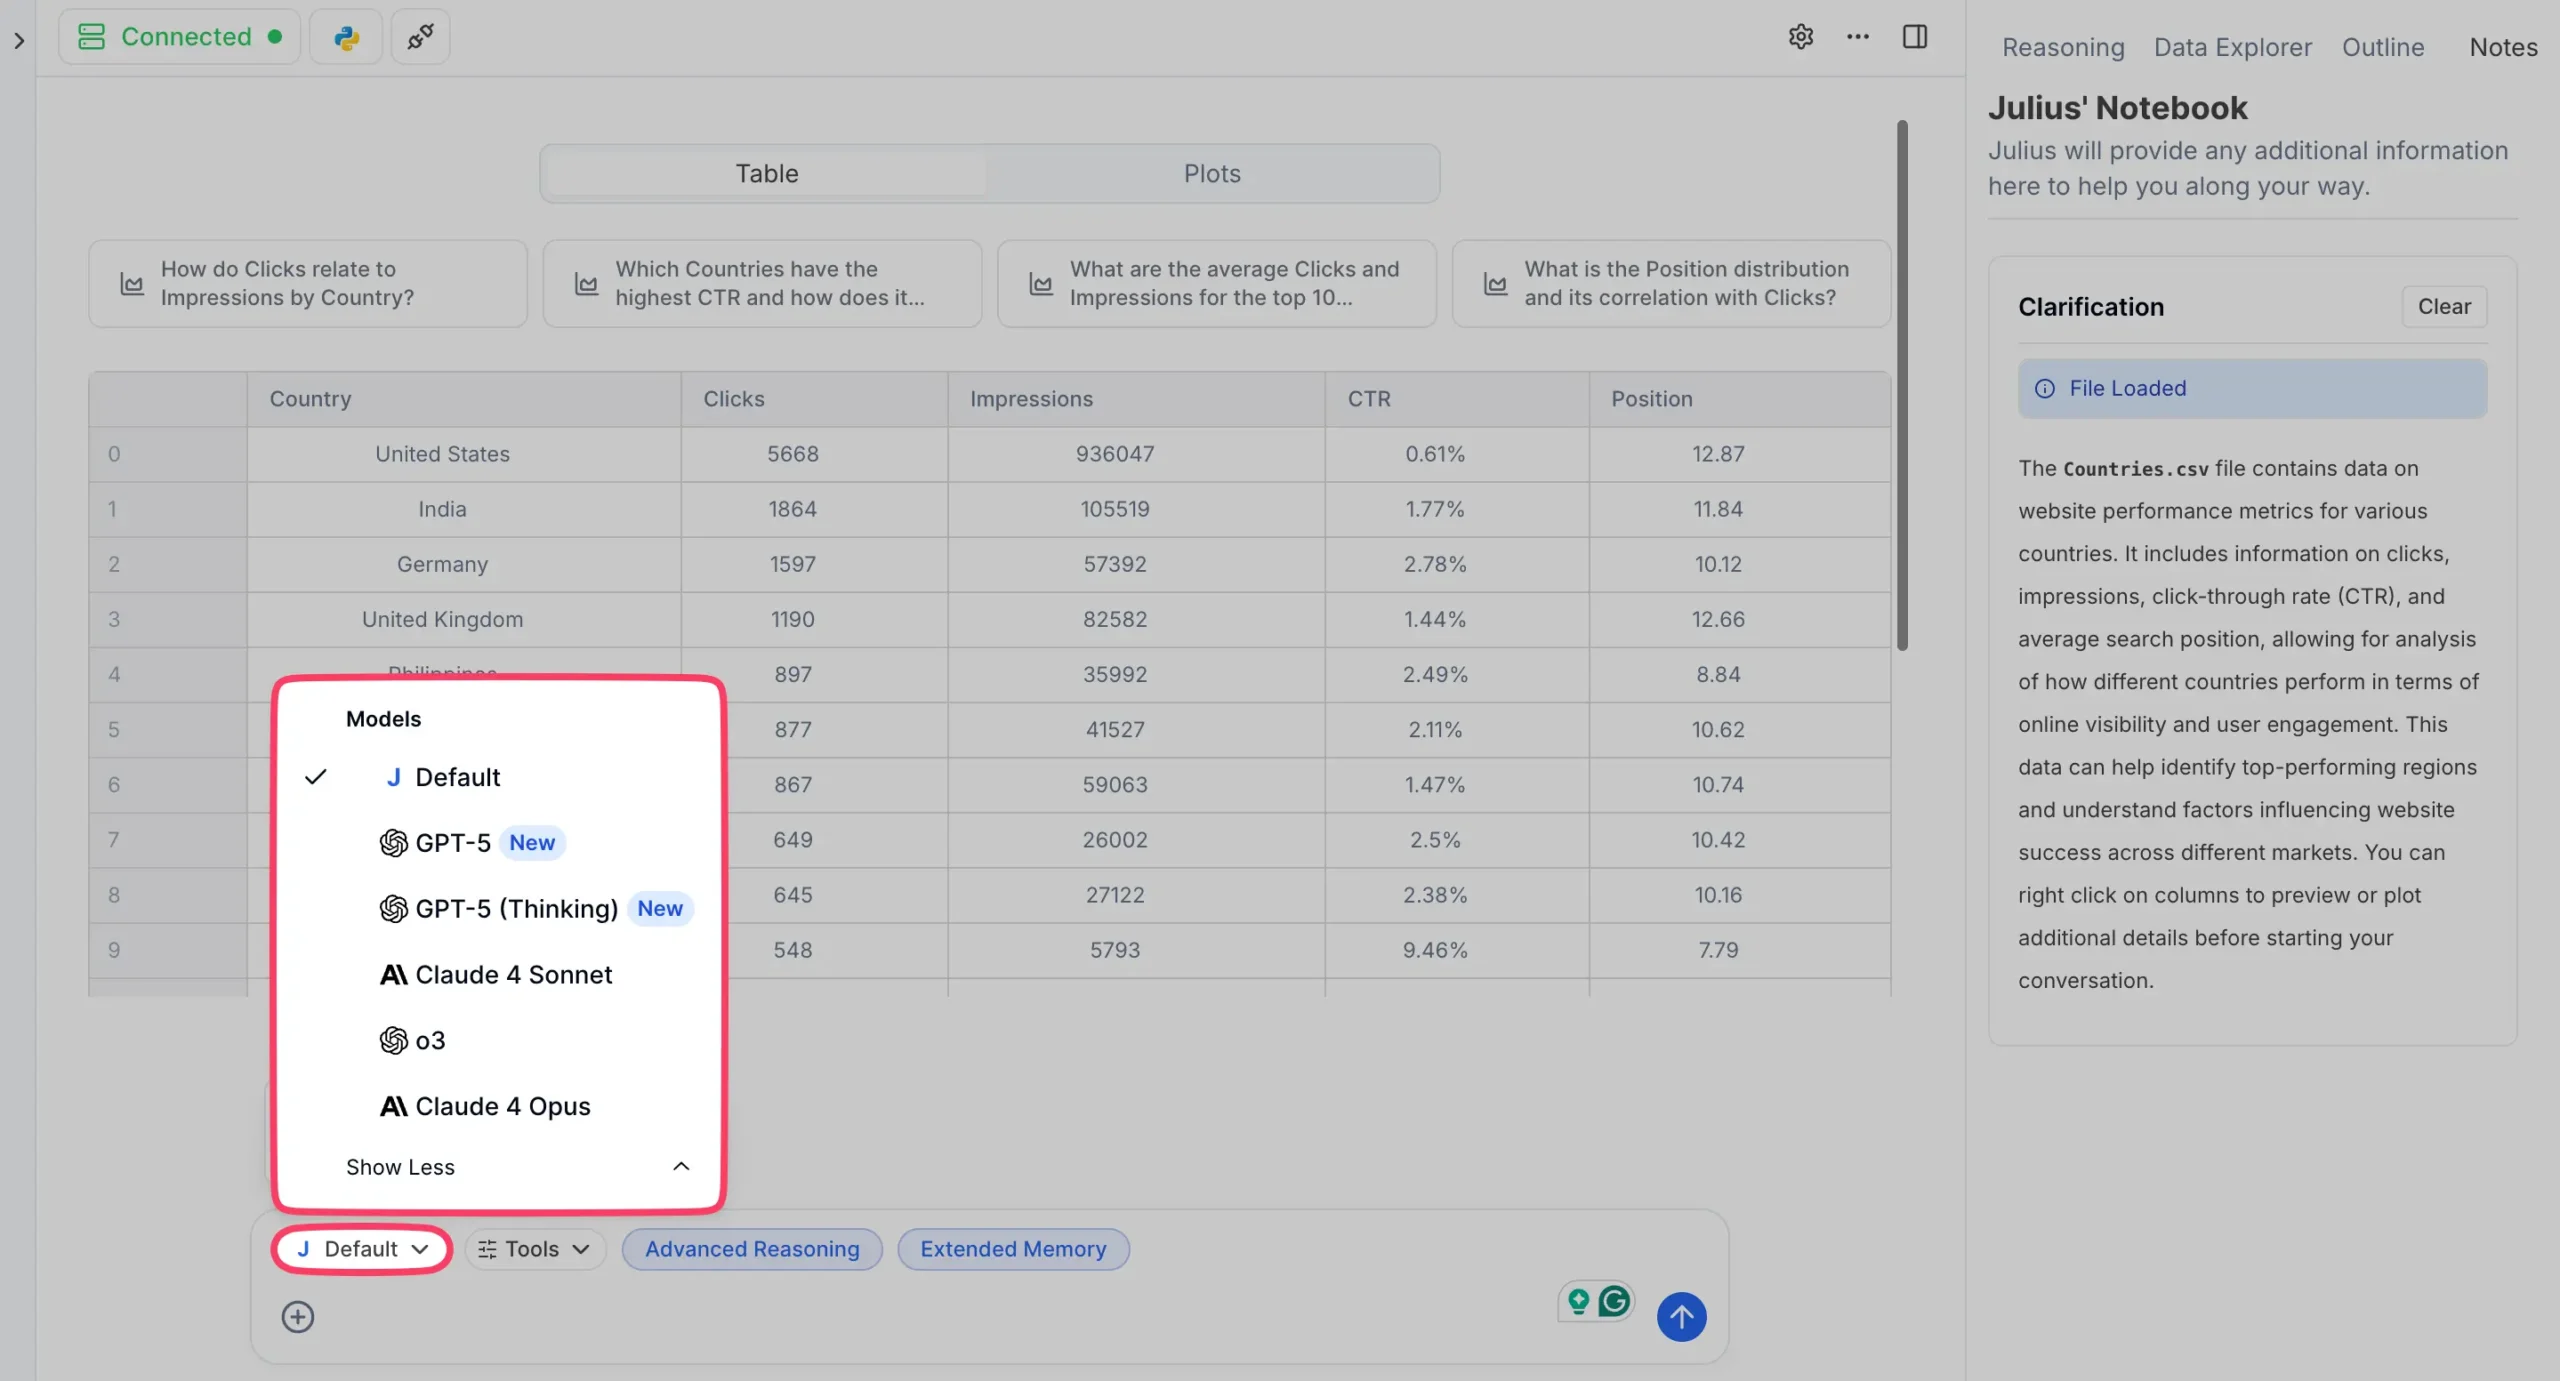
Click the model dropdown (used to say “default”) to see all available AI models. Now you can choose from:
I typically go with Claude 4 Sonnet for most data work. It’s faster and better at understanding data relationships than the older models.
Next are the tools settings:
Advanced Reasoning is more powerful now. Enable it and Julius creates a step-by-step plan before analyzing your data. Instead of jumping straight into code, it thinks through the approach first.
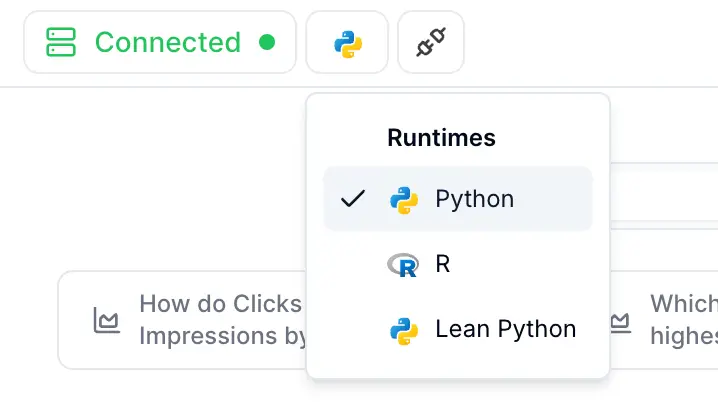
Runtime and Customization
In the top left, you can choose between Python and R. Python handles most use cases, but if you’re doing statistical analysis or academic research, R might be better.
The Settings include a Customize Julius section, basically custom instructions for Julius. Tell it to respond in a certain language, focus on specific metrics, or explain things at a particular level of detail.
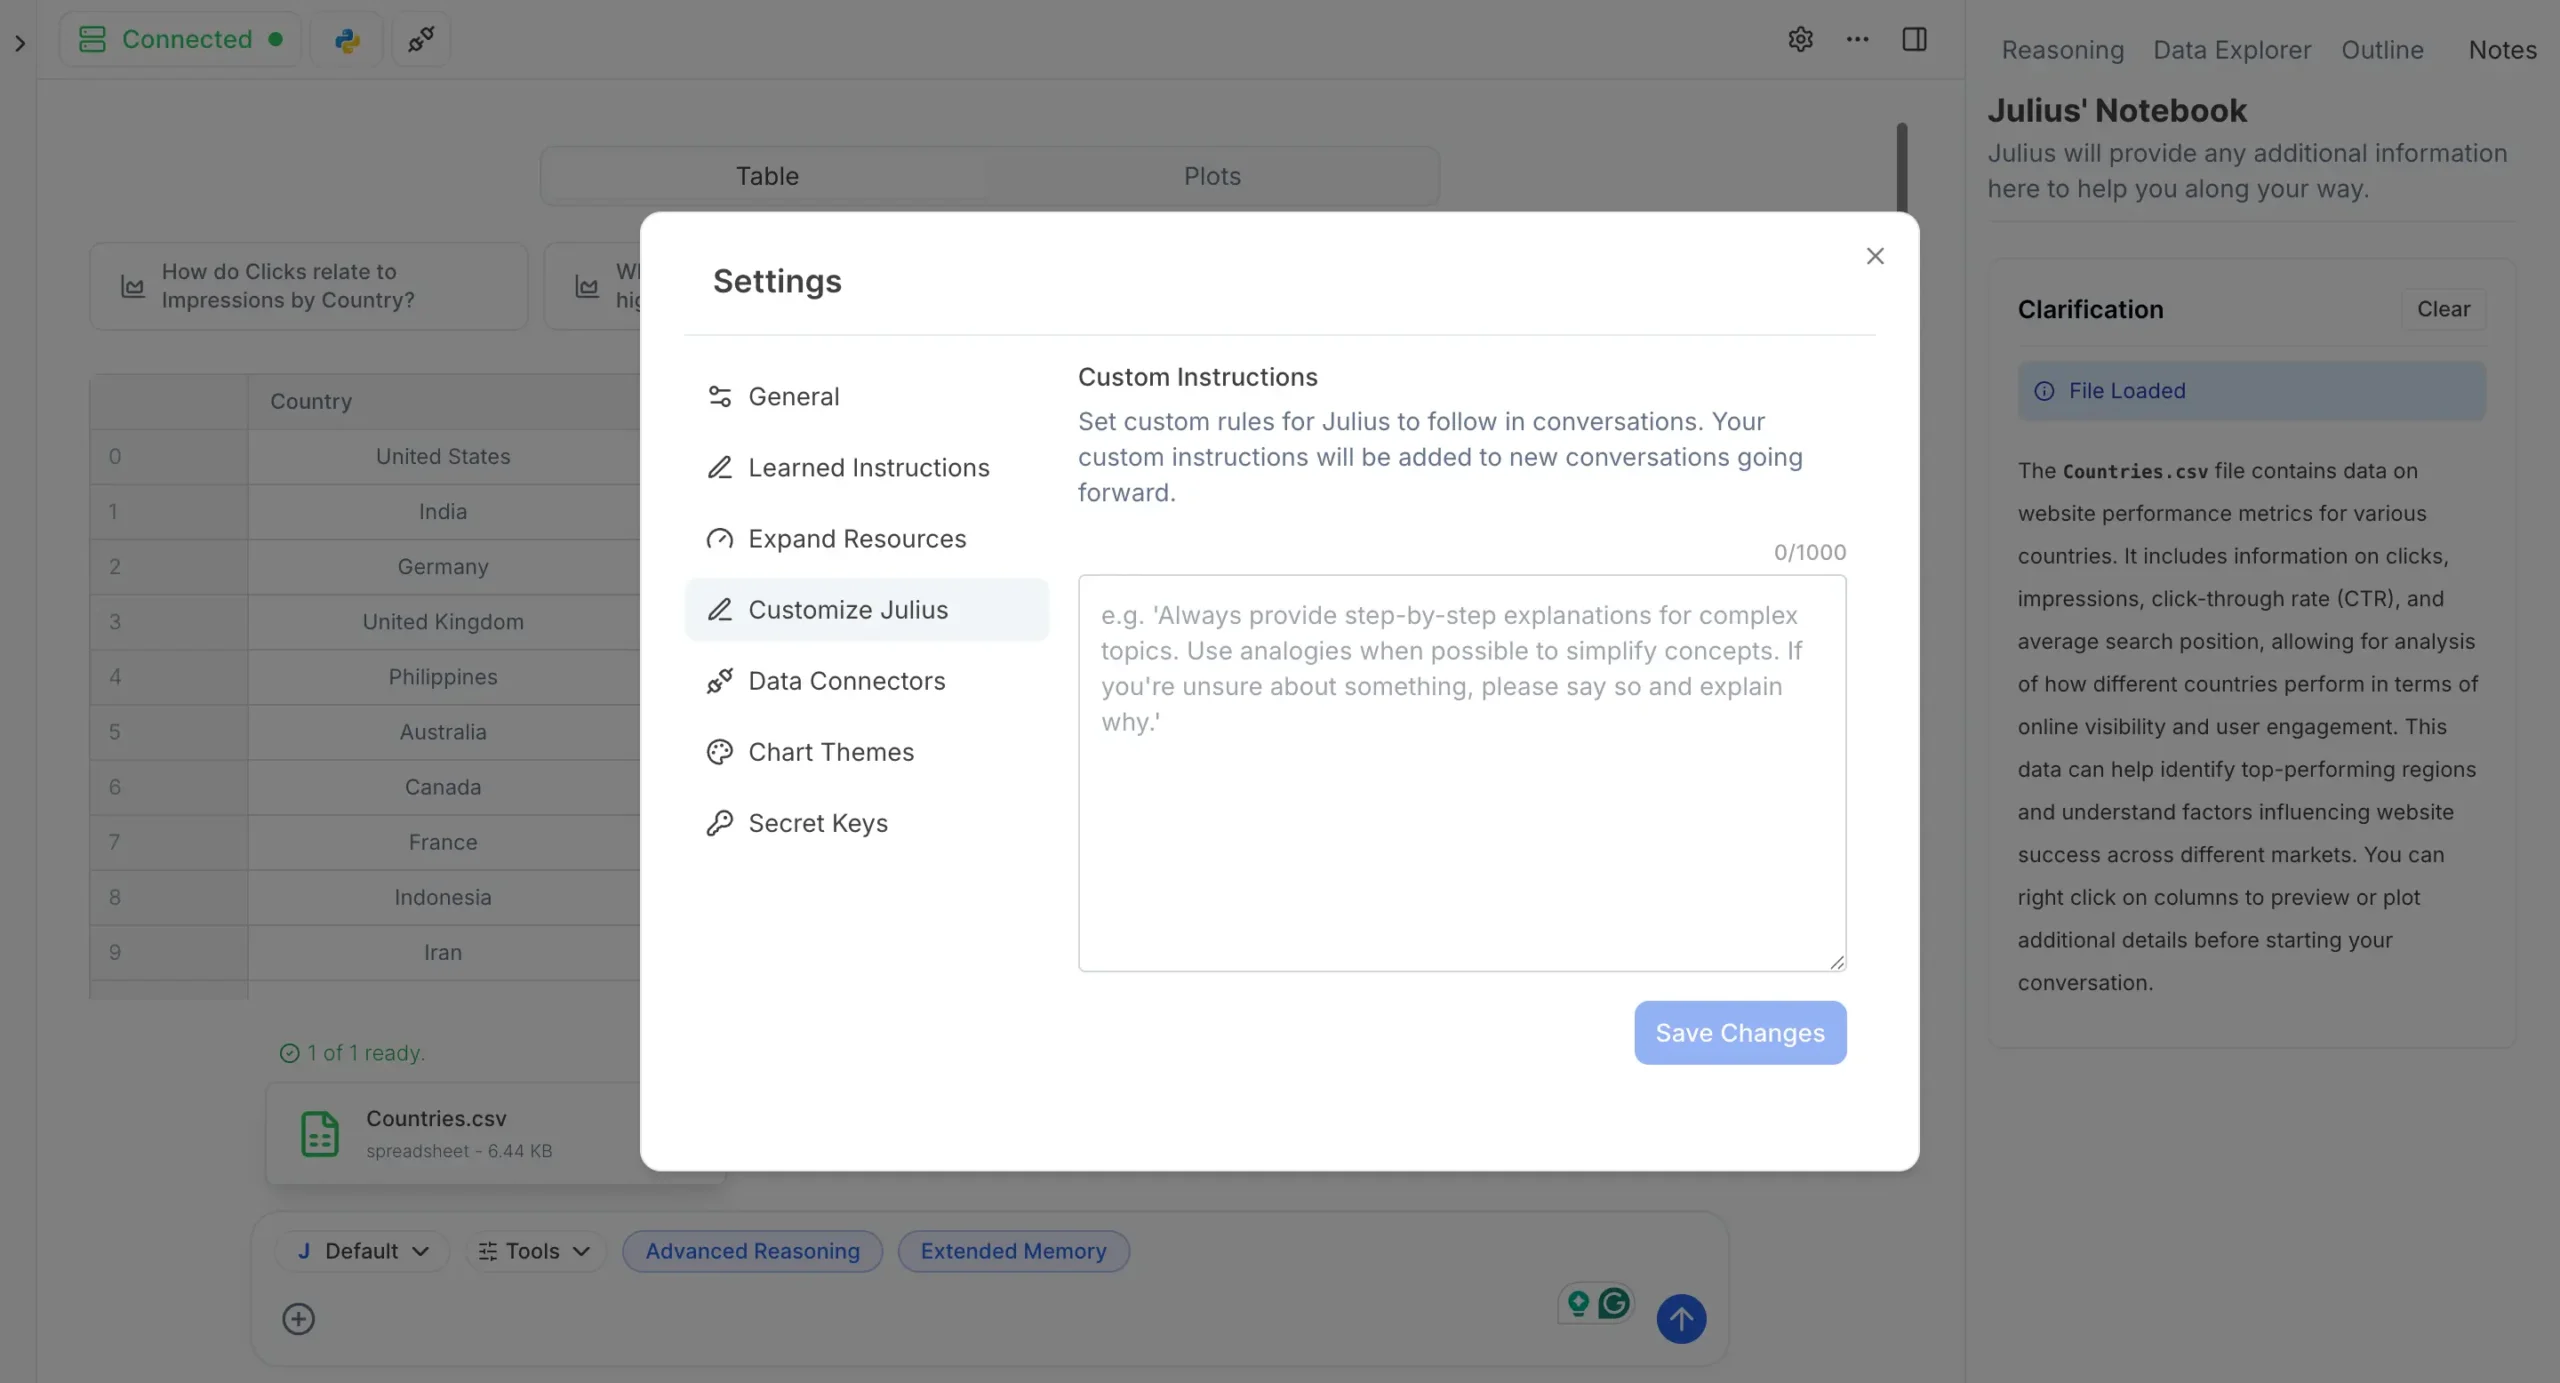
Same concept as ChatGPT’s custom instructions.
Watching Julius Work
Here’s where it gets interesting. Instead of giving Julius a specific command, I just hit enter to see what happens.
Within seconds, Julius starts understanding the data.
First, it loads and examines the data using Python code. You can see exactly what it’s doing – the code is right there. You can even edit the code if you want to change something.
Then it displays a sample of the data in a clean table format.
Finally, it suggests what you might want to do next. These suggestions are usually spot-on.

Real Analysis in Action
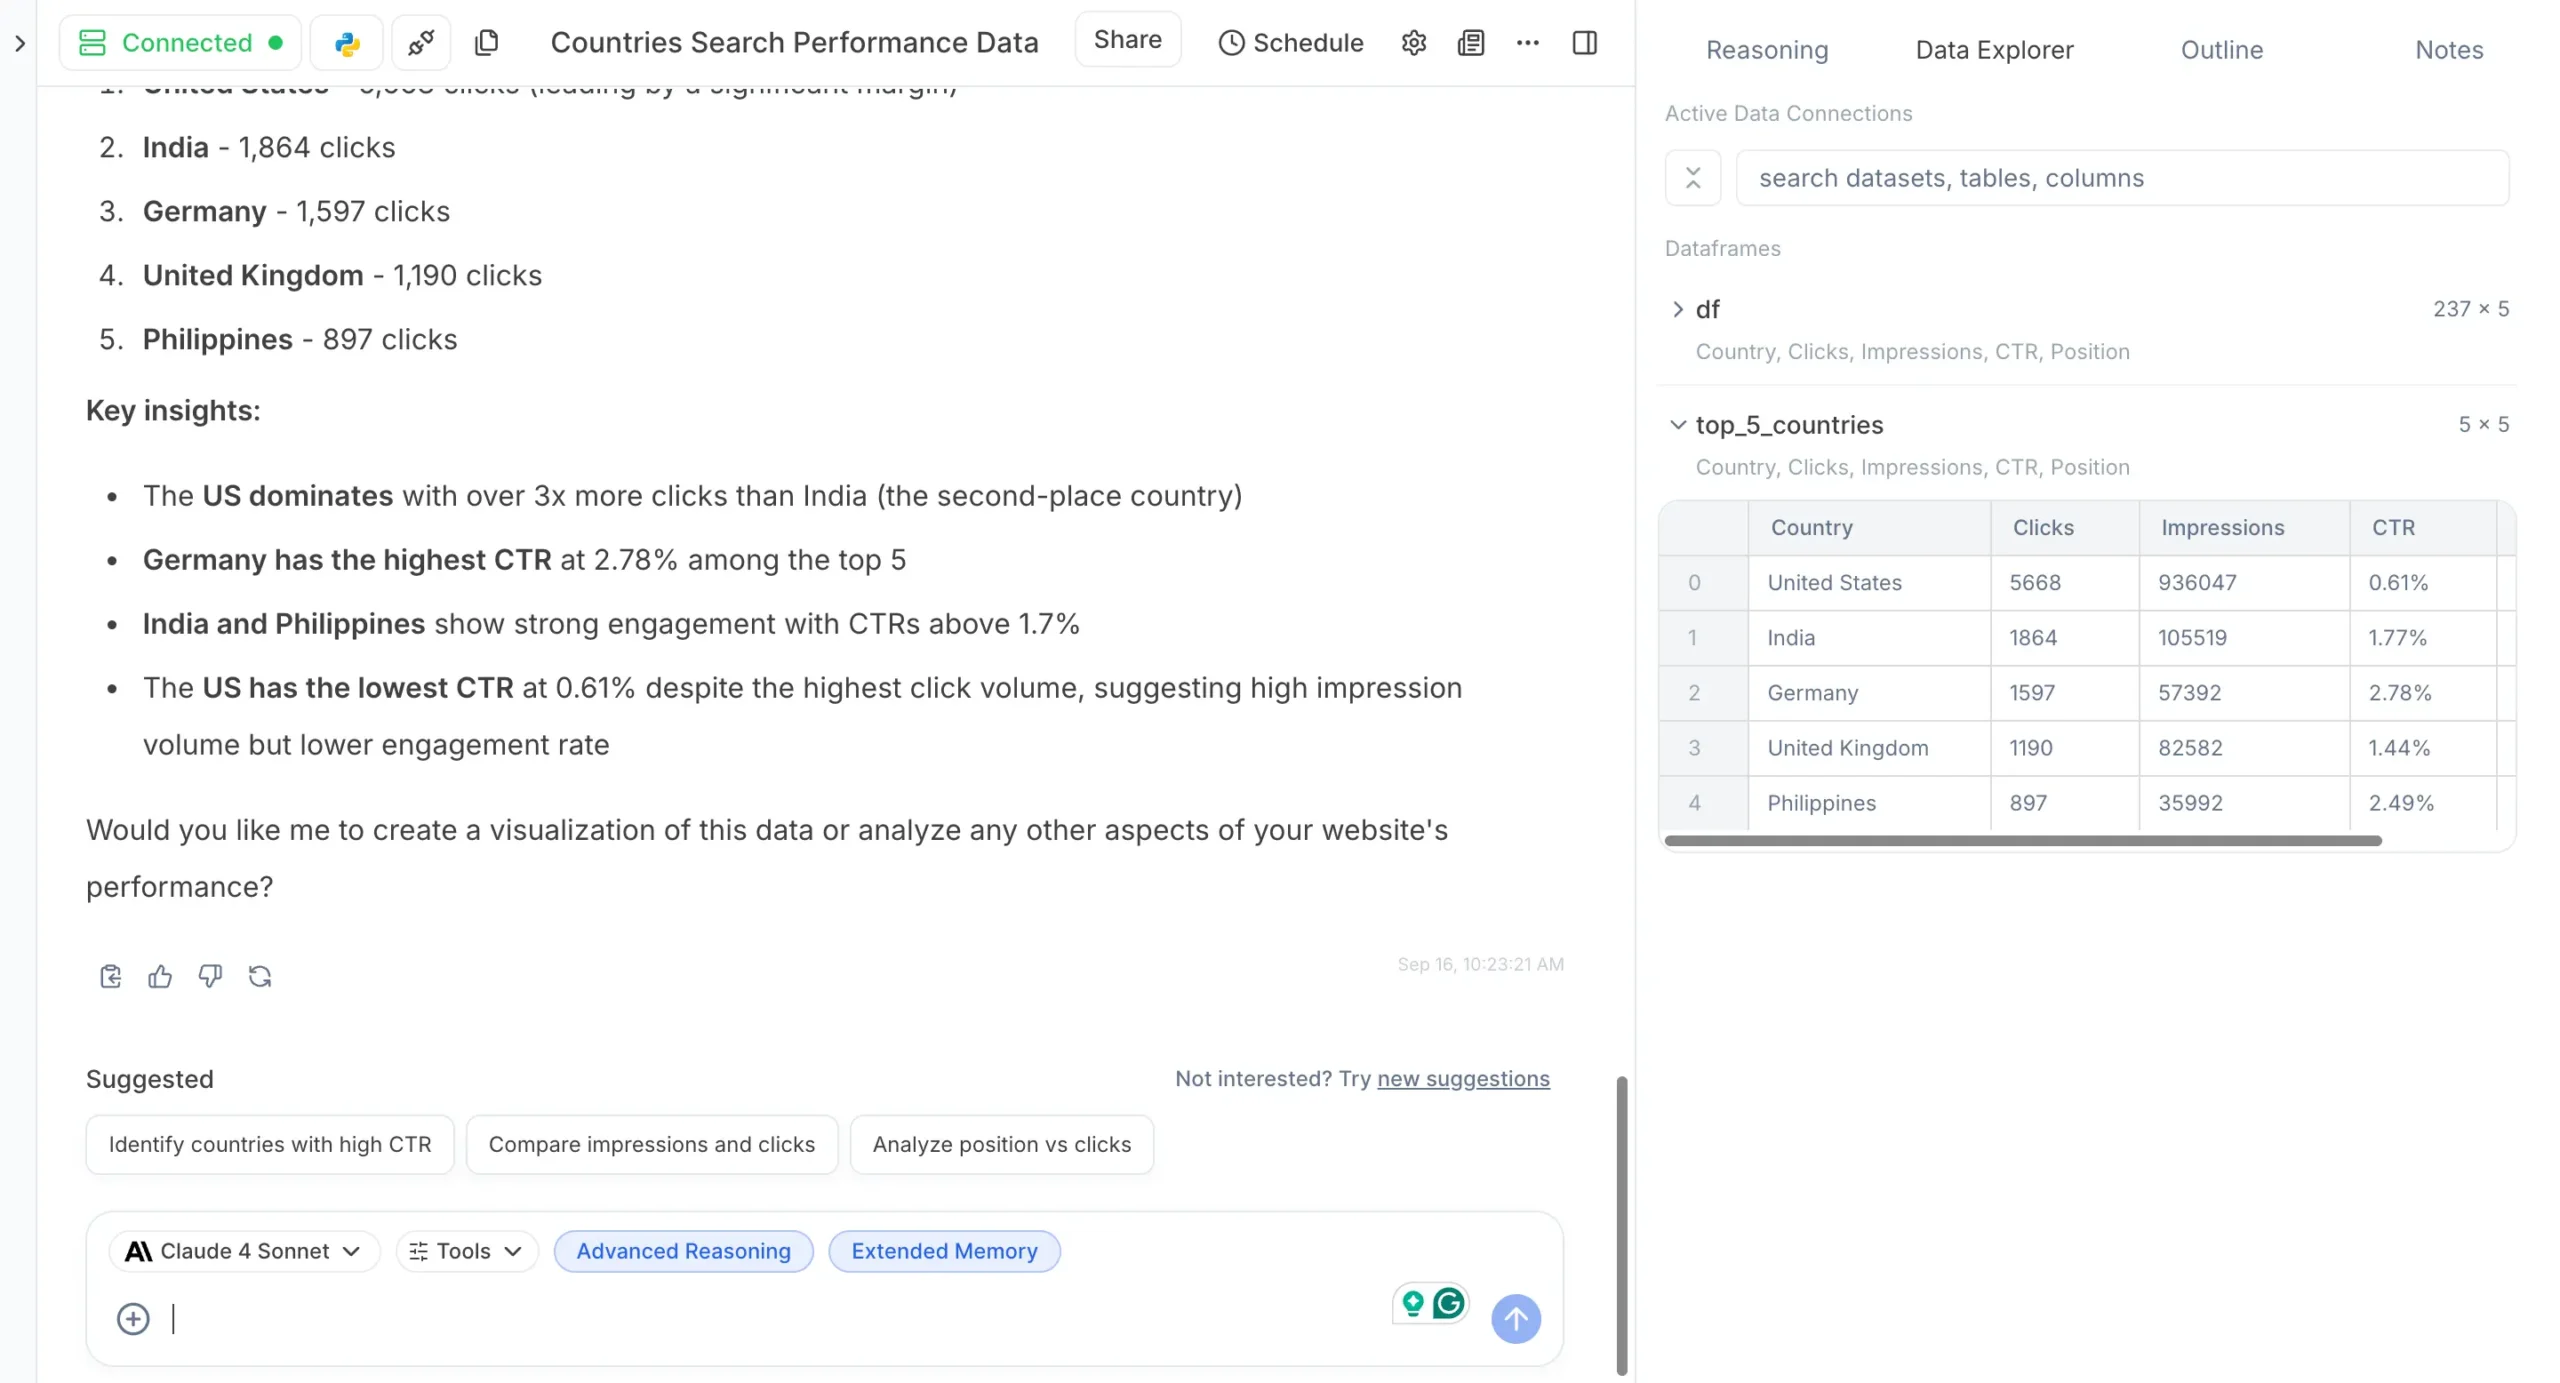
Let me ask Julius something specific: “What are the top five countries bringing the most clicks to my website?”
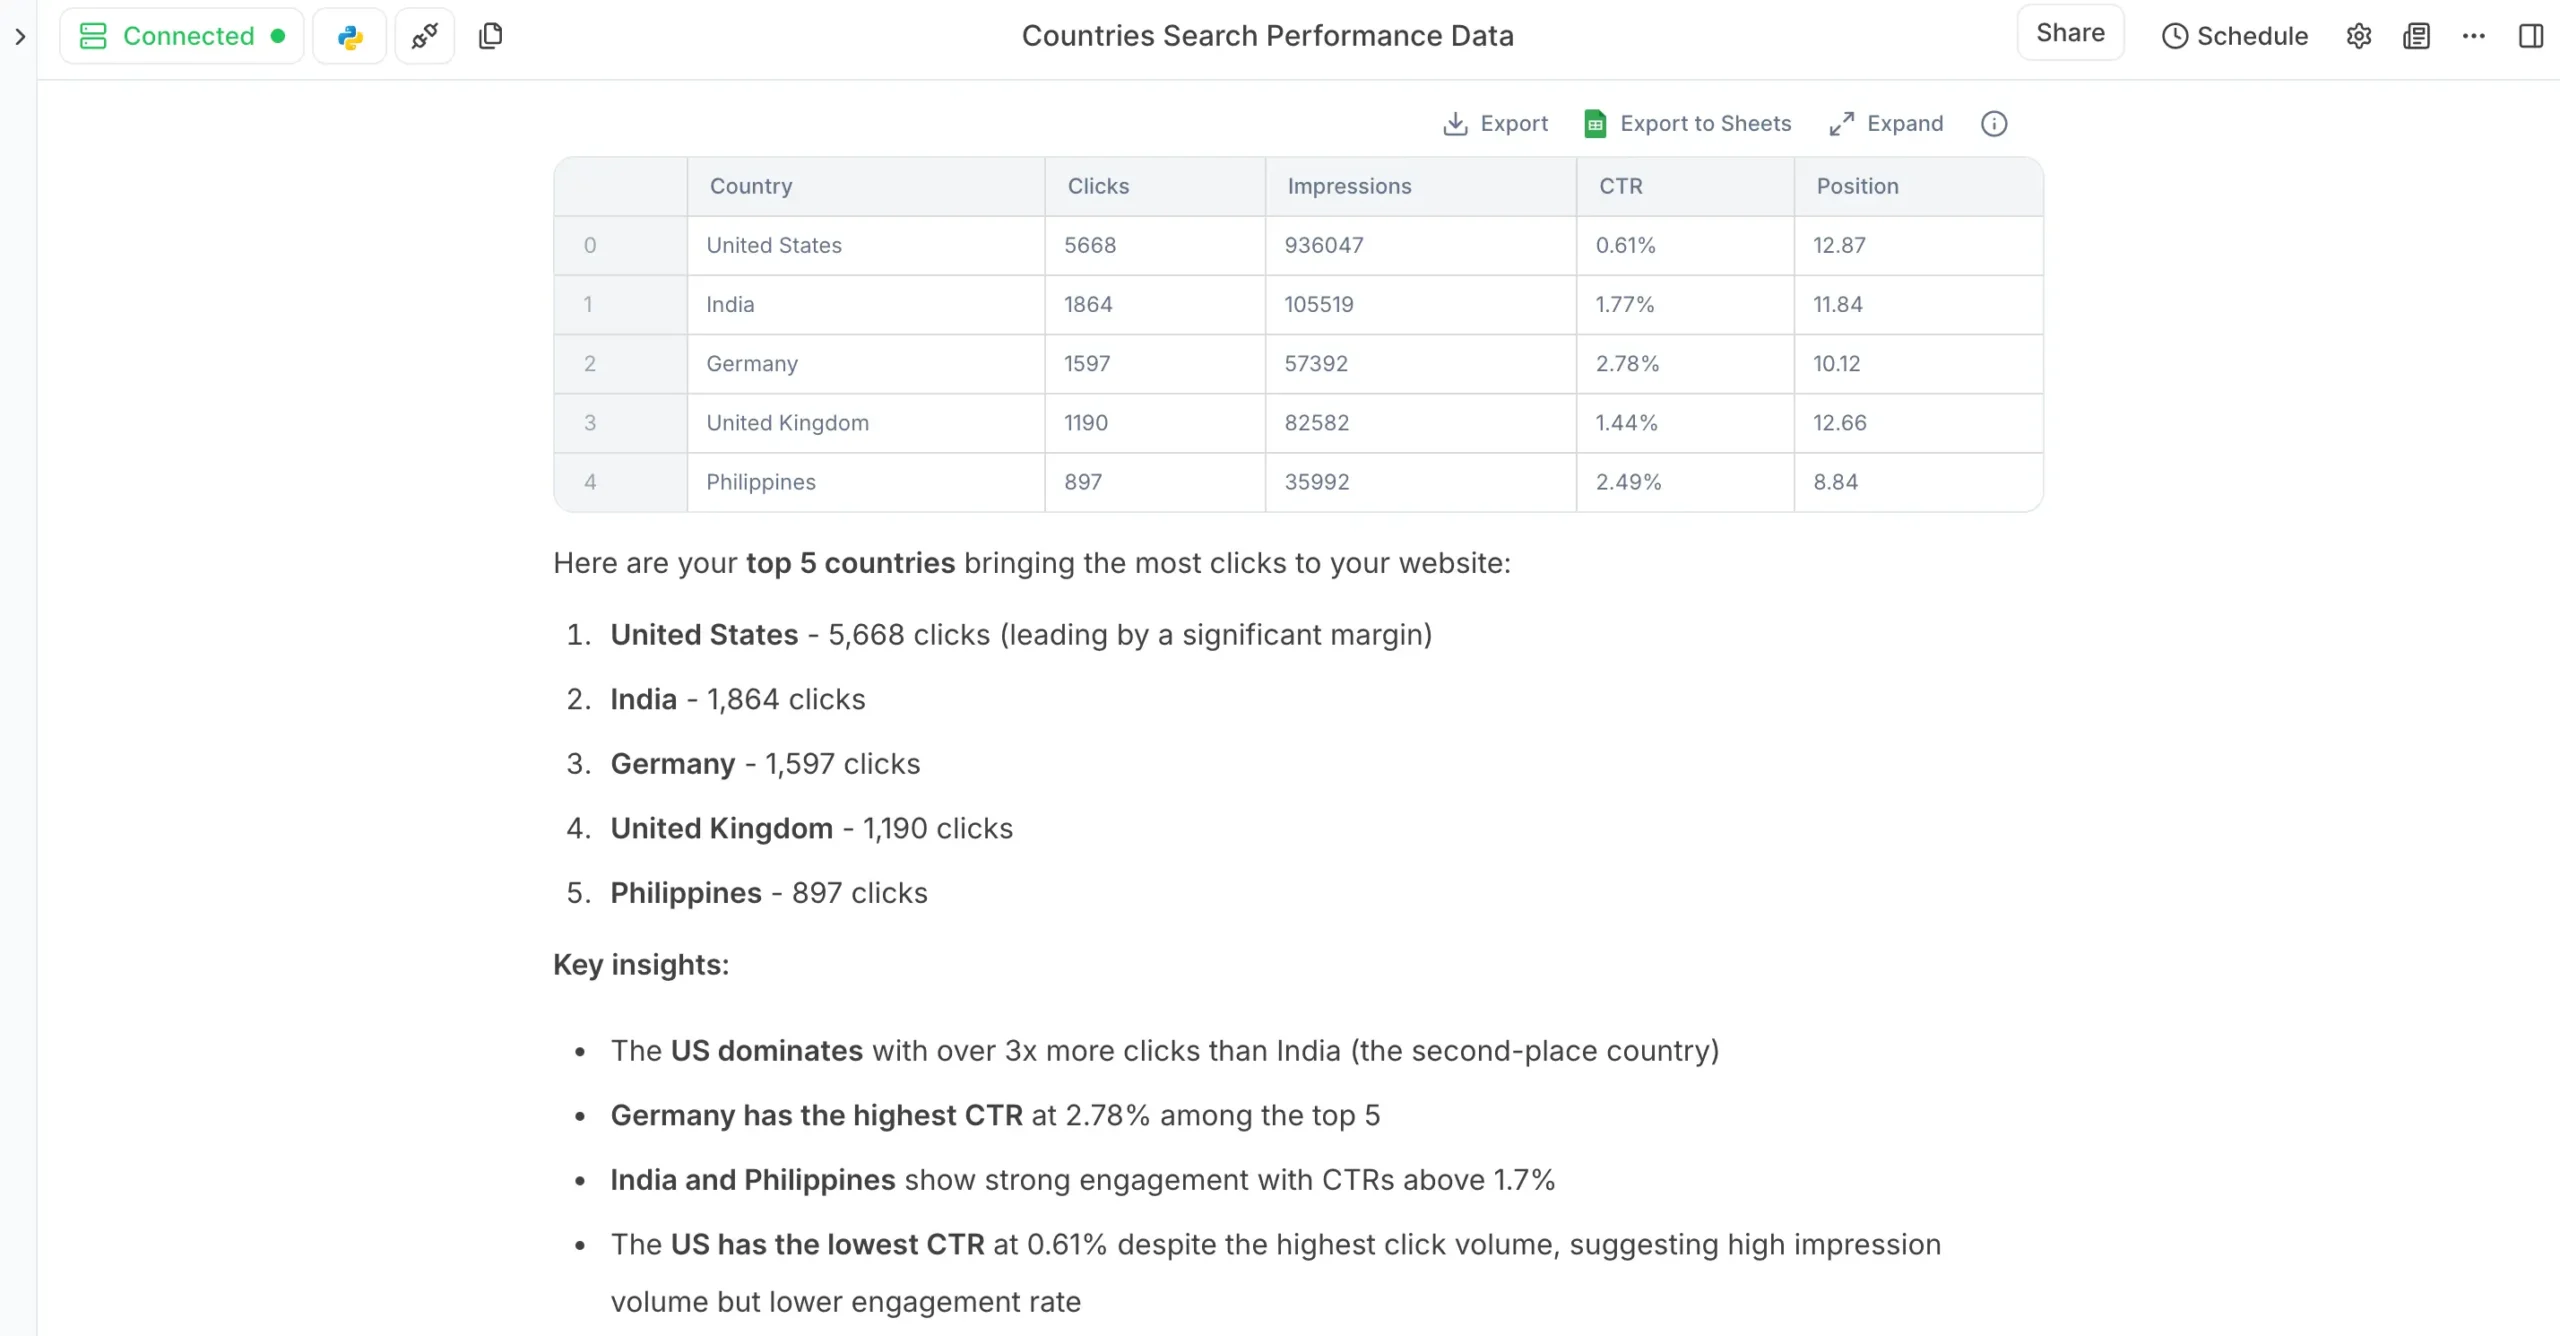
Julius immediately:
- Identifies the relevant columns
- Sorts the data correctly
- Returns the top 5 results
- Formats it in a readable way
- Also gives me key insights that I didn’t know I needed
This is a simple example, but it shows how natural the interaction feels. I described what I wanted in plain English, and Julius figured out the technical details.
The Data Explorer Connection
Here’s something new: every table Julius creates now appears in the Data Explorer on the right side of your screen. Click “Expand” on any table to see it in full detail.
From Data Explorer, you can:
This transparency is crucial. You’re not just trusting Julius’s analysis – you can see exactly what data it’s working with.
Beyond Simple Queries
This example barely scratches the surface. With the same conversational interface, you can:
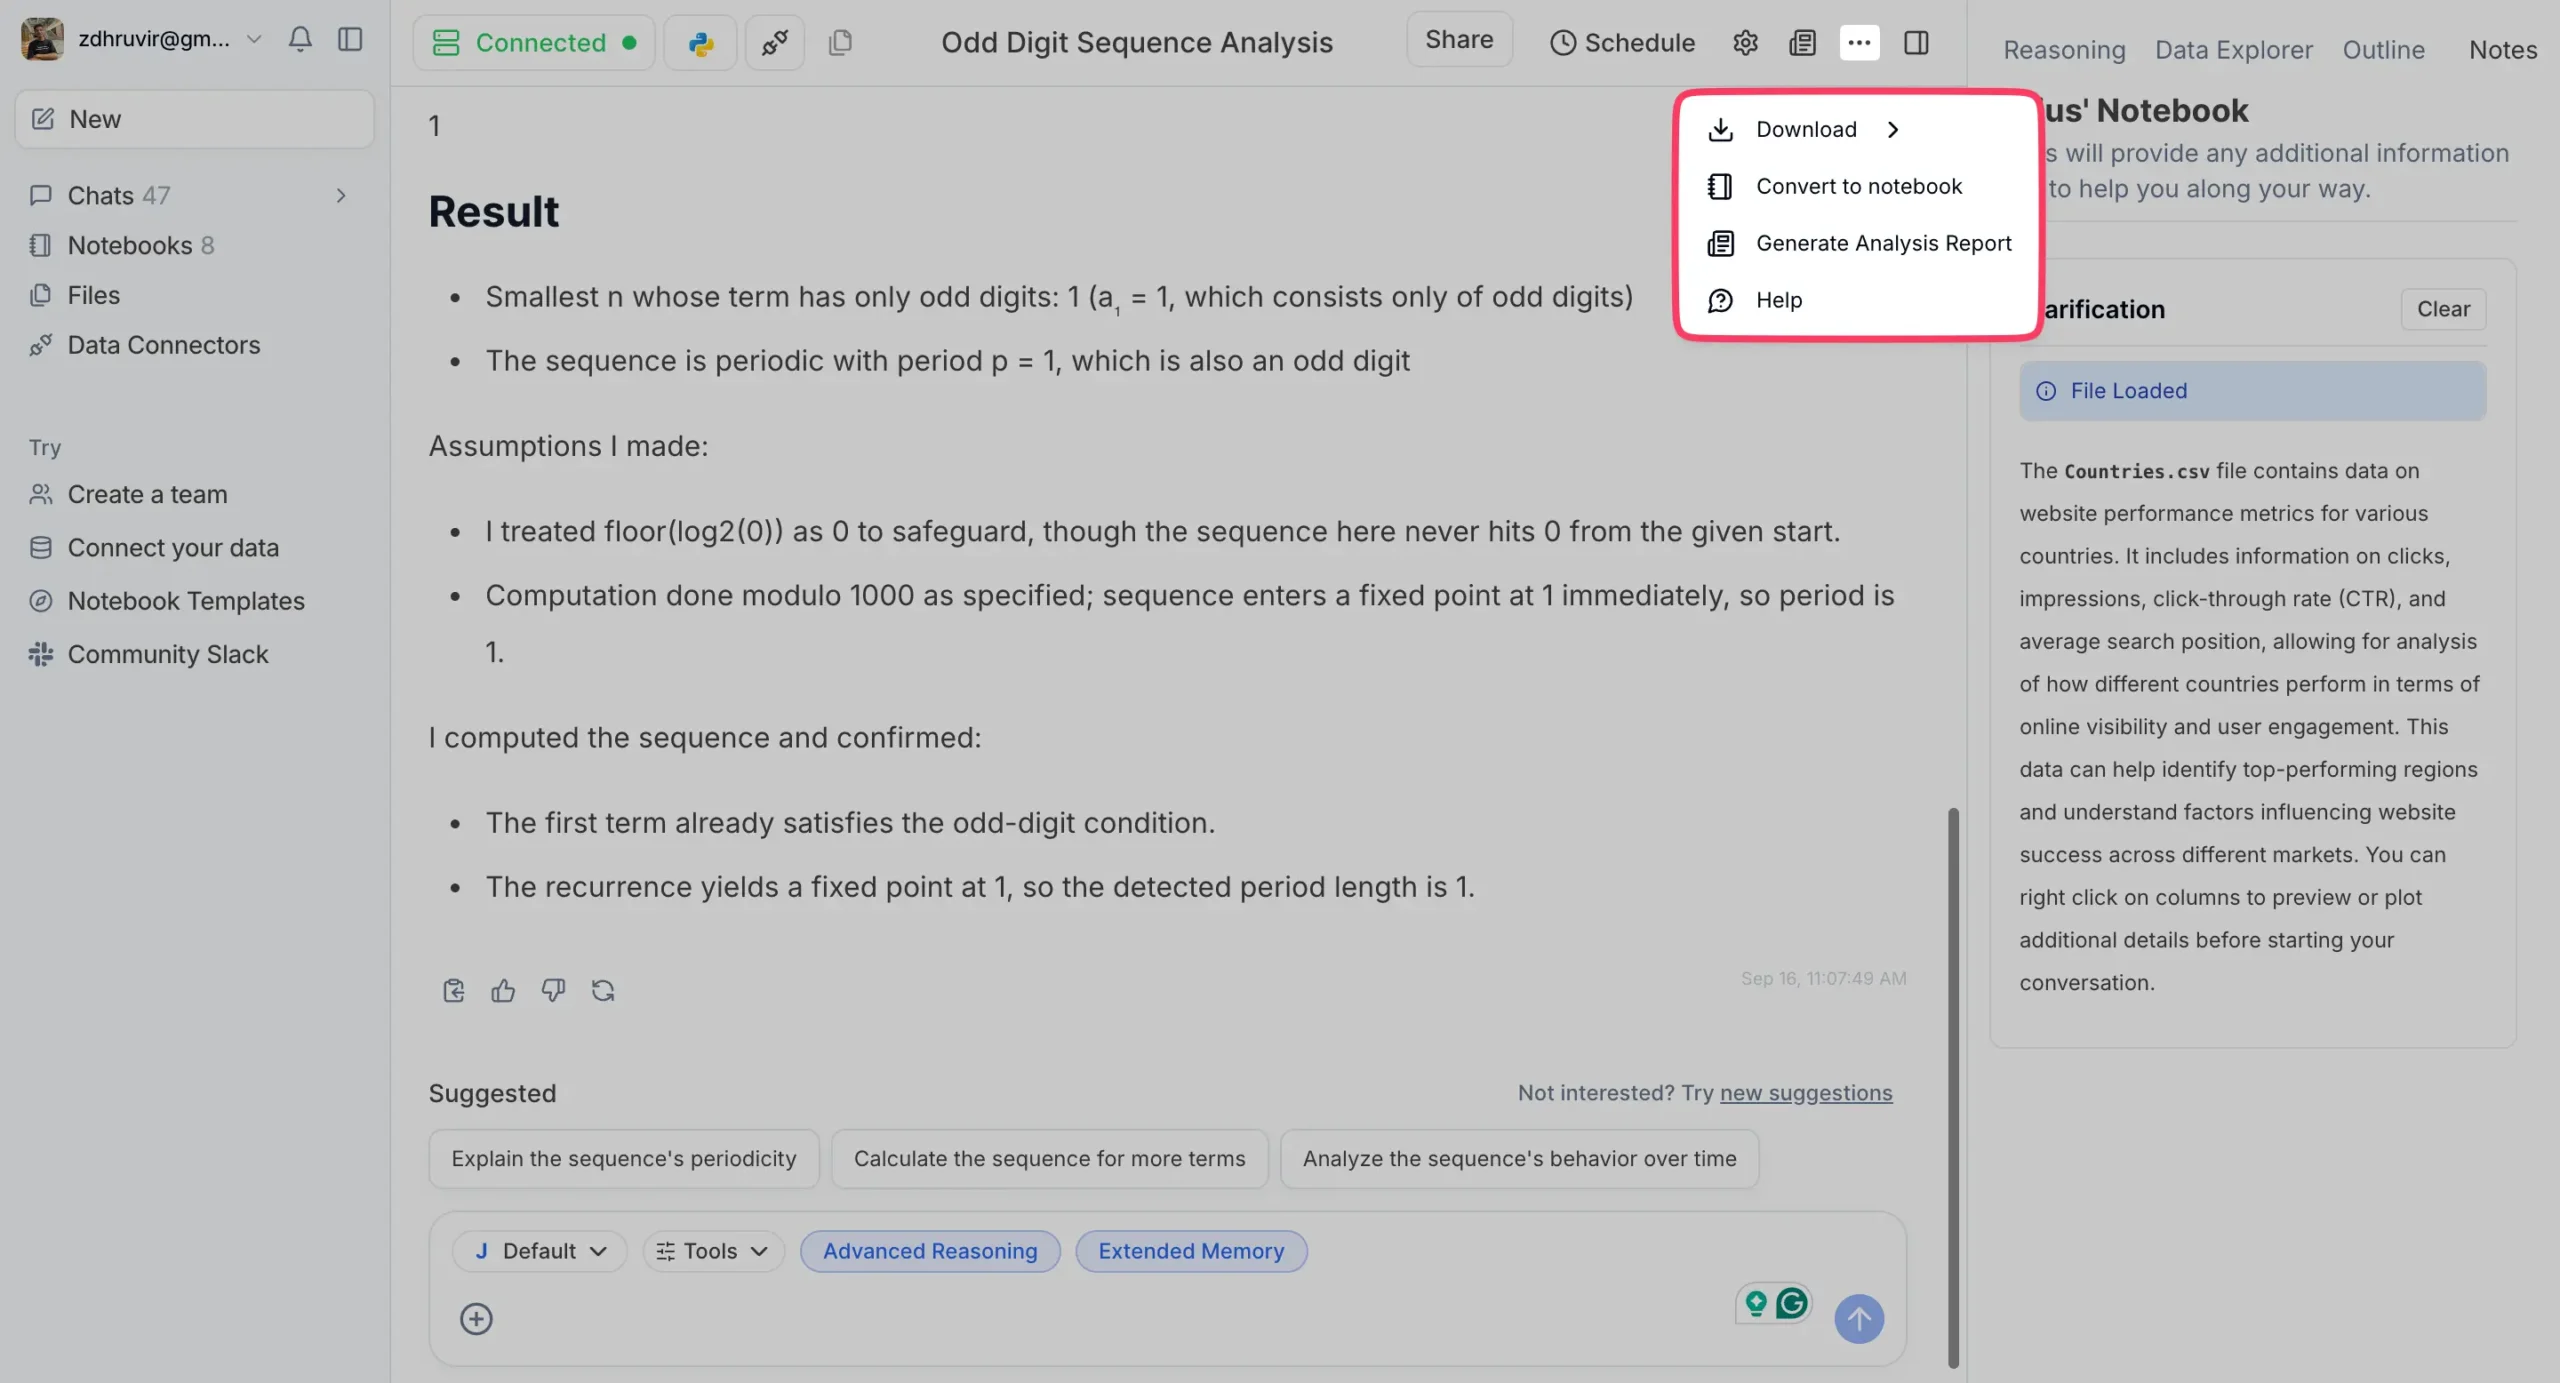
And if you find yourself doing similar analysis repeatedly, you can convert the entire conversation into a reusable Notebook. More on that later.
The key insight: Julius transforms data analysis from a technical skill into a conversation. If you can describe what you want to know, Julius can probably figure out how to find it.
Data Visualization
Julius AI makes it effortless to visualize your data. You can create almost any type of chart or diagram that exists.
But what’s new is how much control you have over how they look. Julius now has Chart Themes that completely change the visual style of your charts.
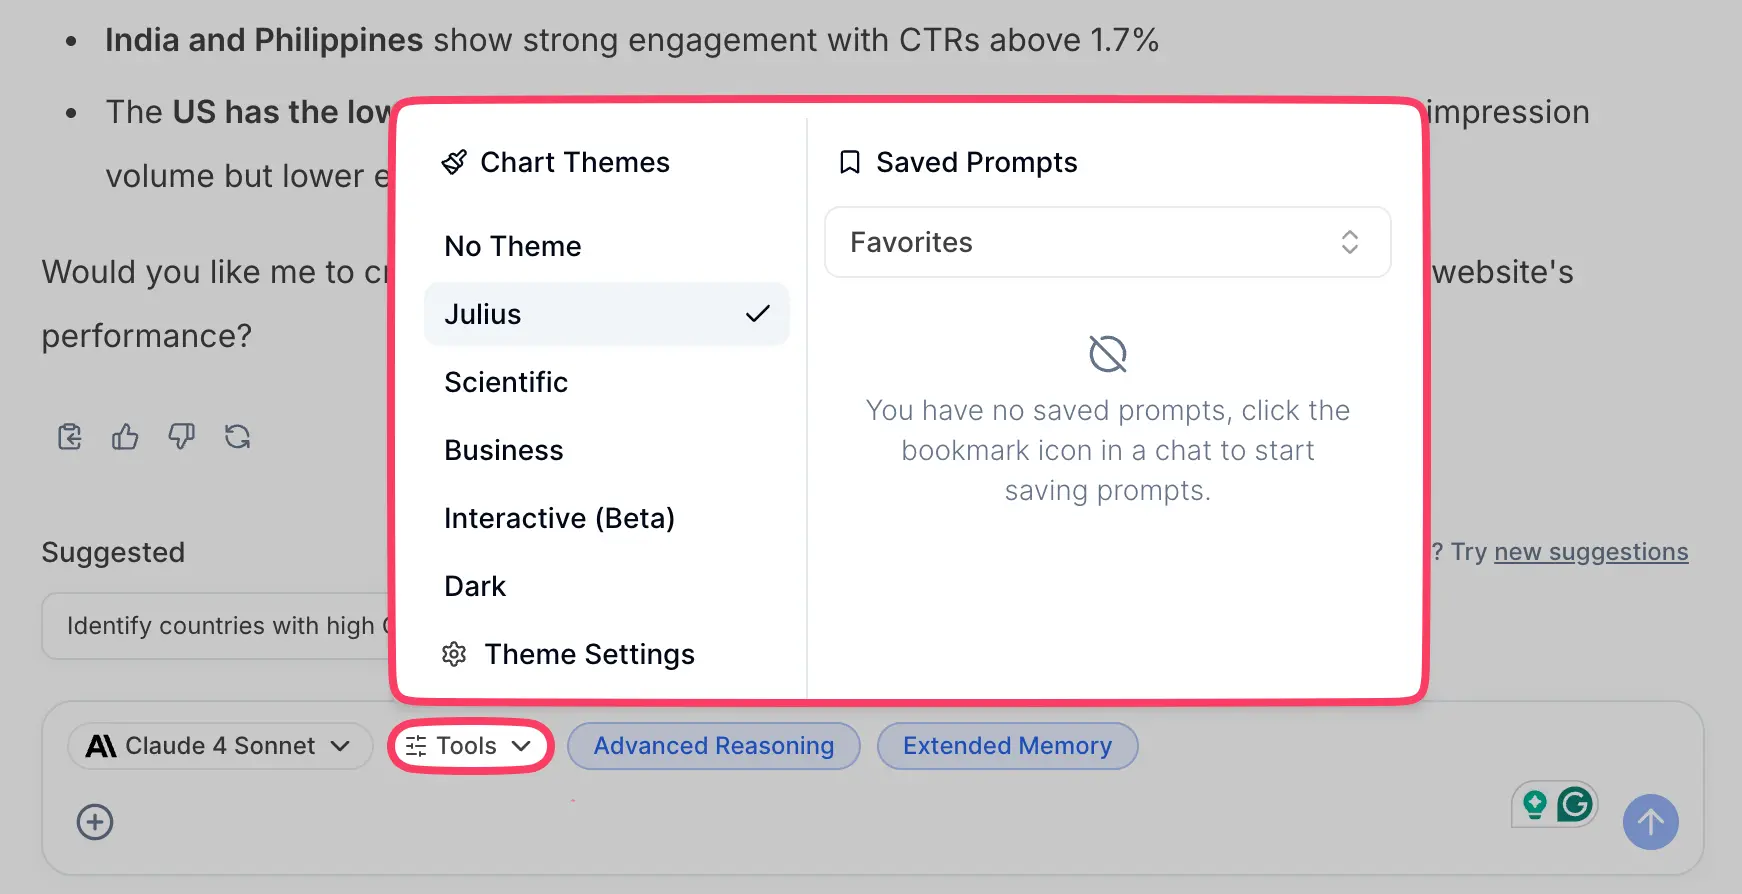
Choose from themes like:

Each theme completely transforms how your visualizations look.
The Scientific theme gives you clean, academic-style charts perfect for research papers. The Business theme creates polished visualizations ready for executive presentations.
What Julius Can Create
The range of visualizations is honestly ridiculous:
The list goes on. Julius doesn’t mess around when you give it data to visualize.
Creating Your First Visualization
Let’s see what we can do with my Google Search Console data.
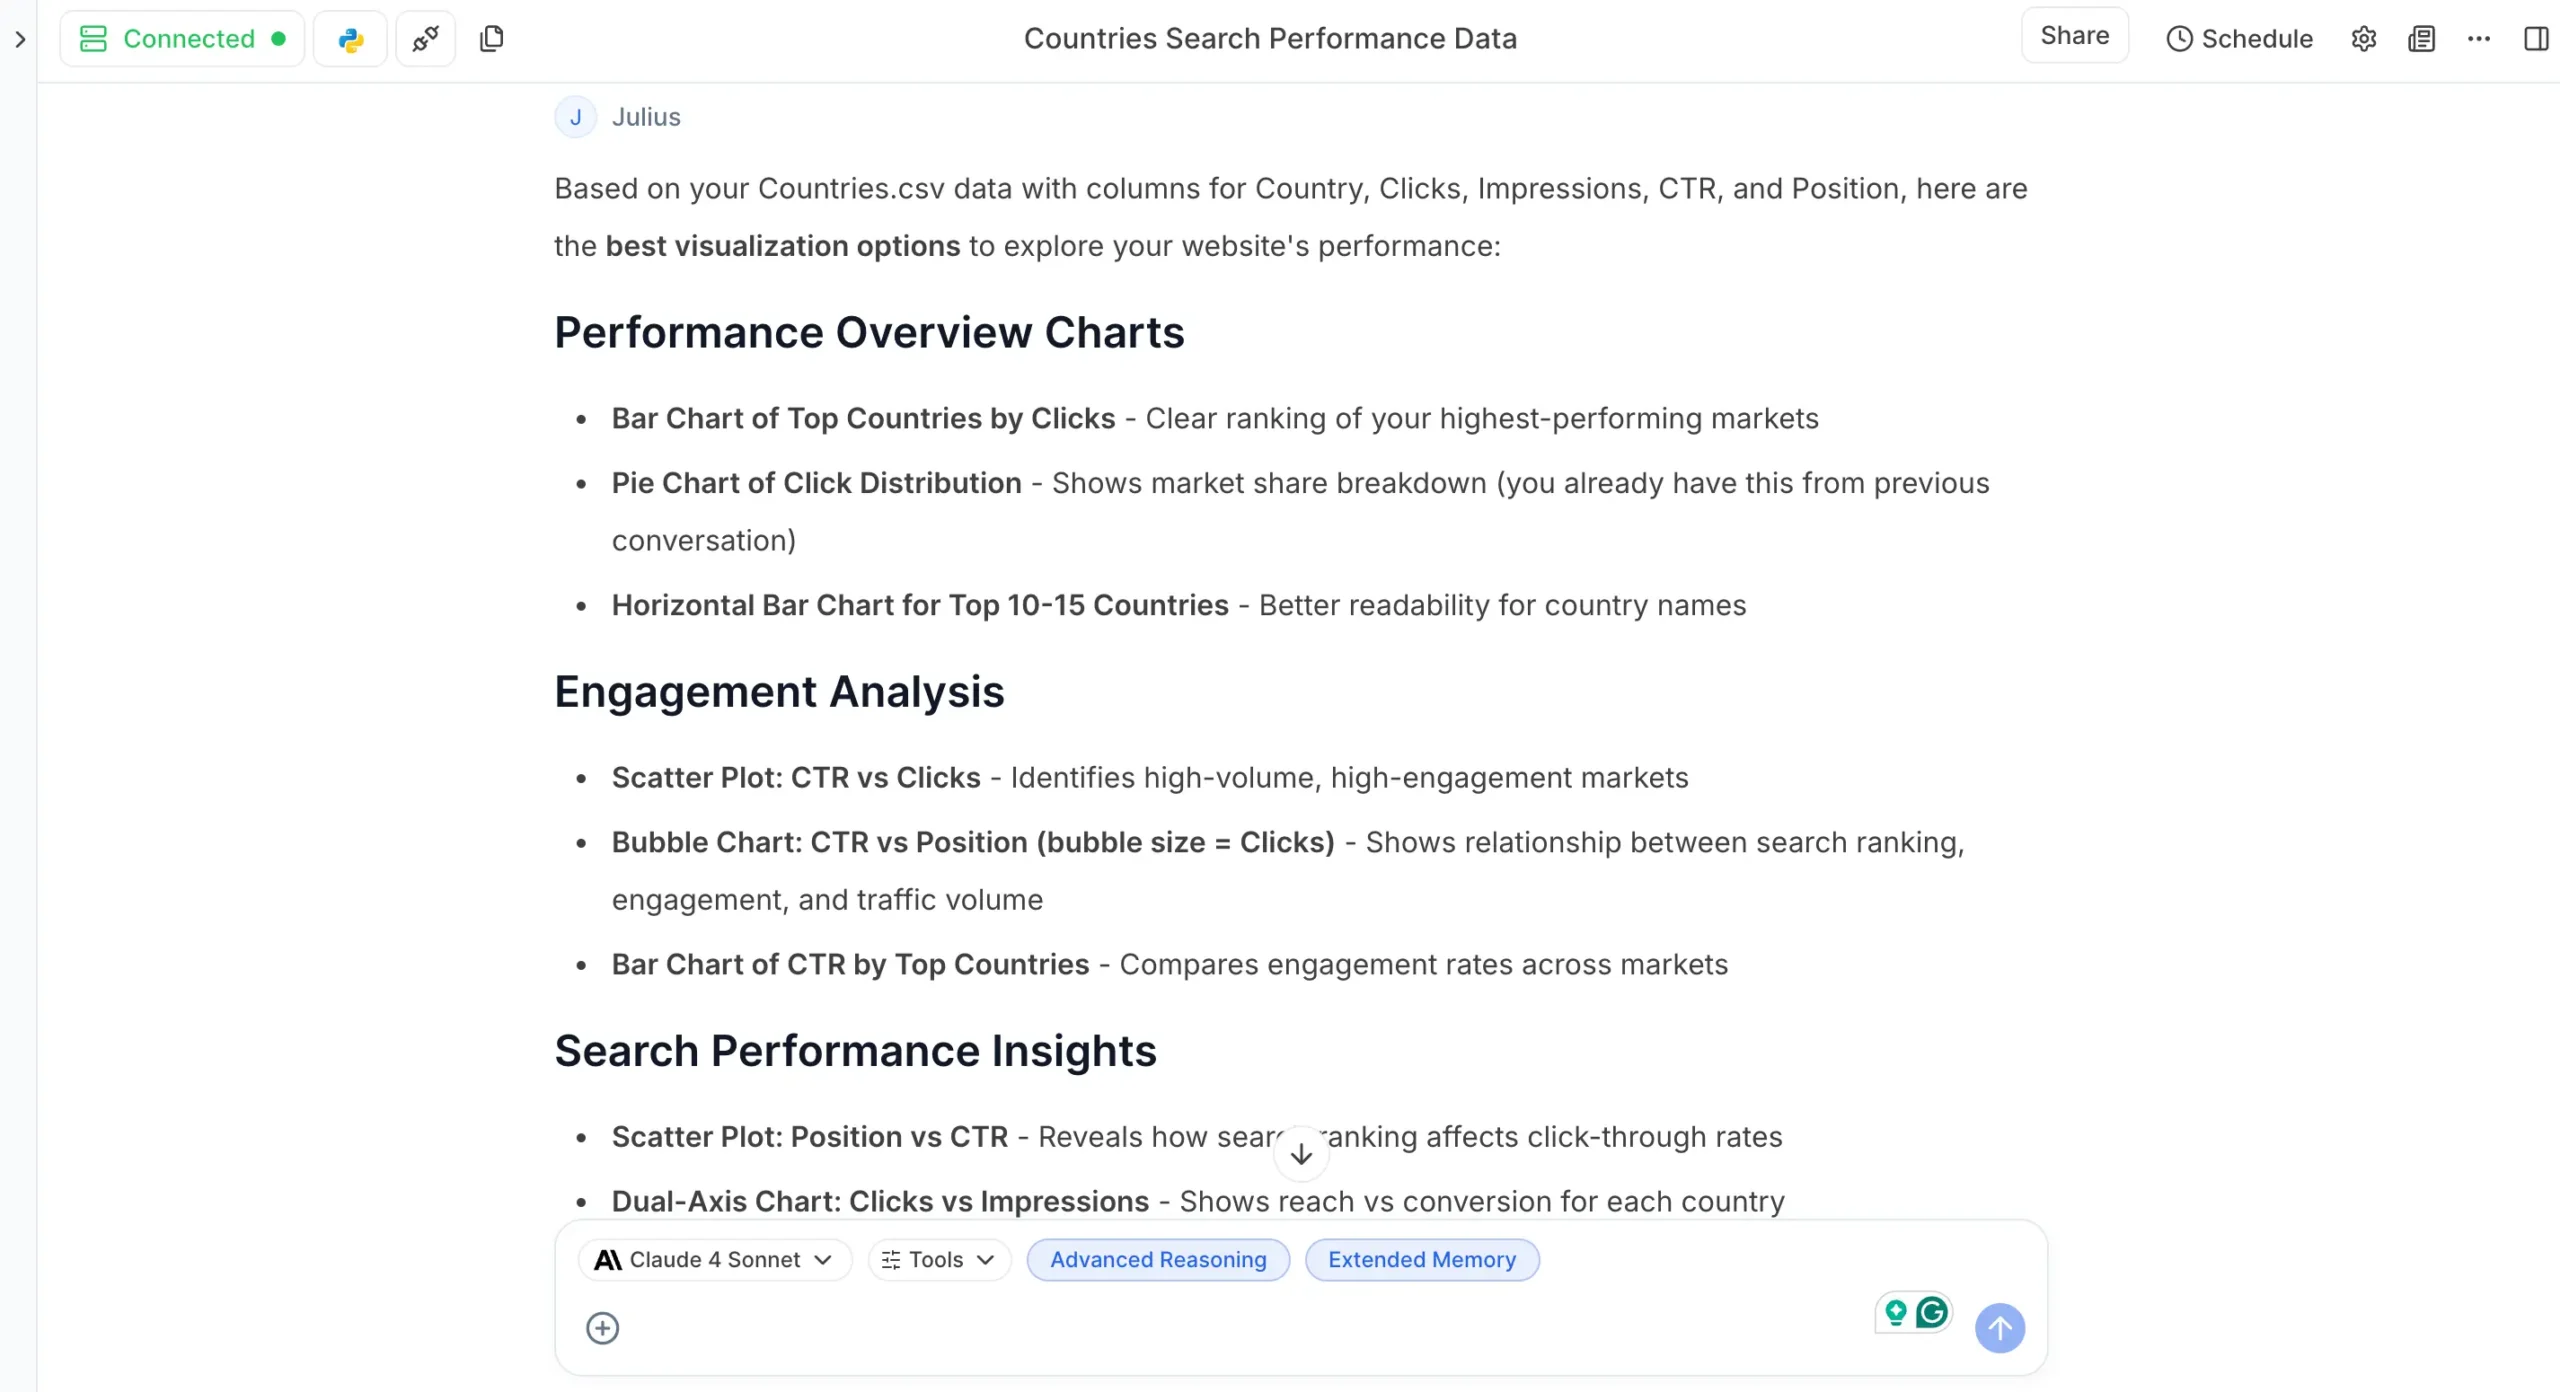
I ask Julius to look at at my uploaded file and suggest visualization options.
Julius examines the file and lists the main columns. Then it suggests different visualizations I can create, explaining the purpose of each one.
I ask it to create a bar chart comparing clicks across the top 10 countries by clicks.
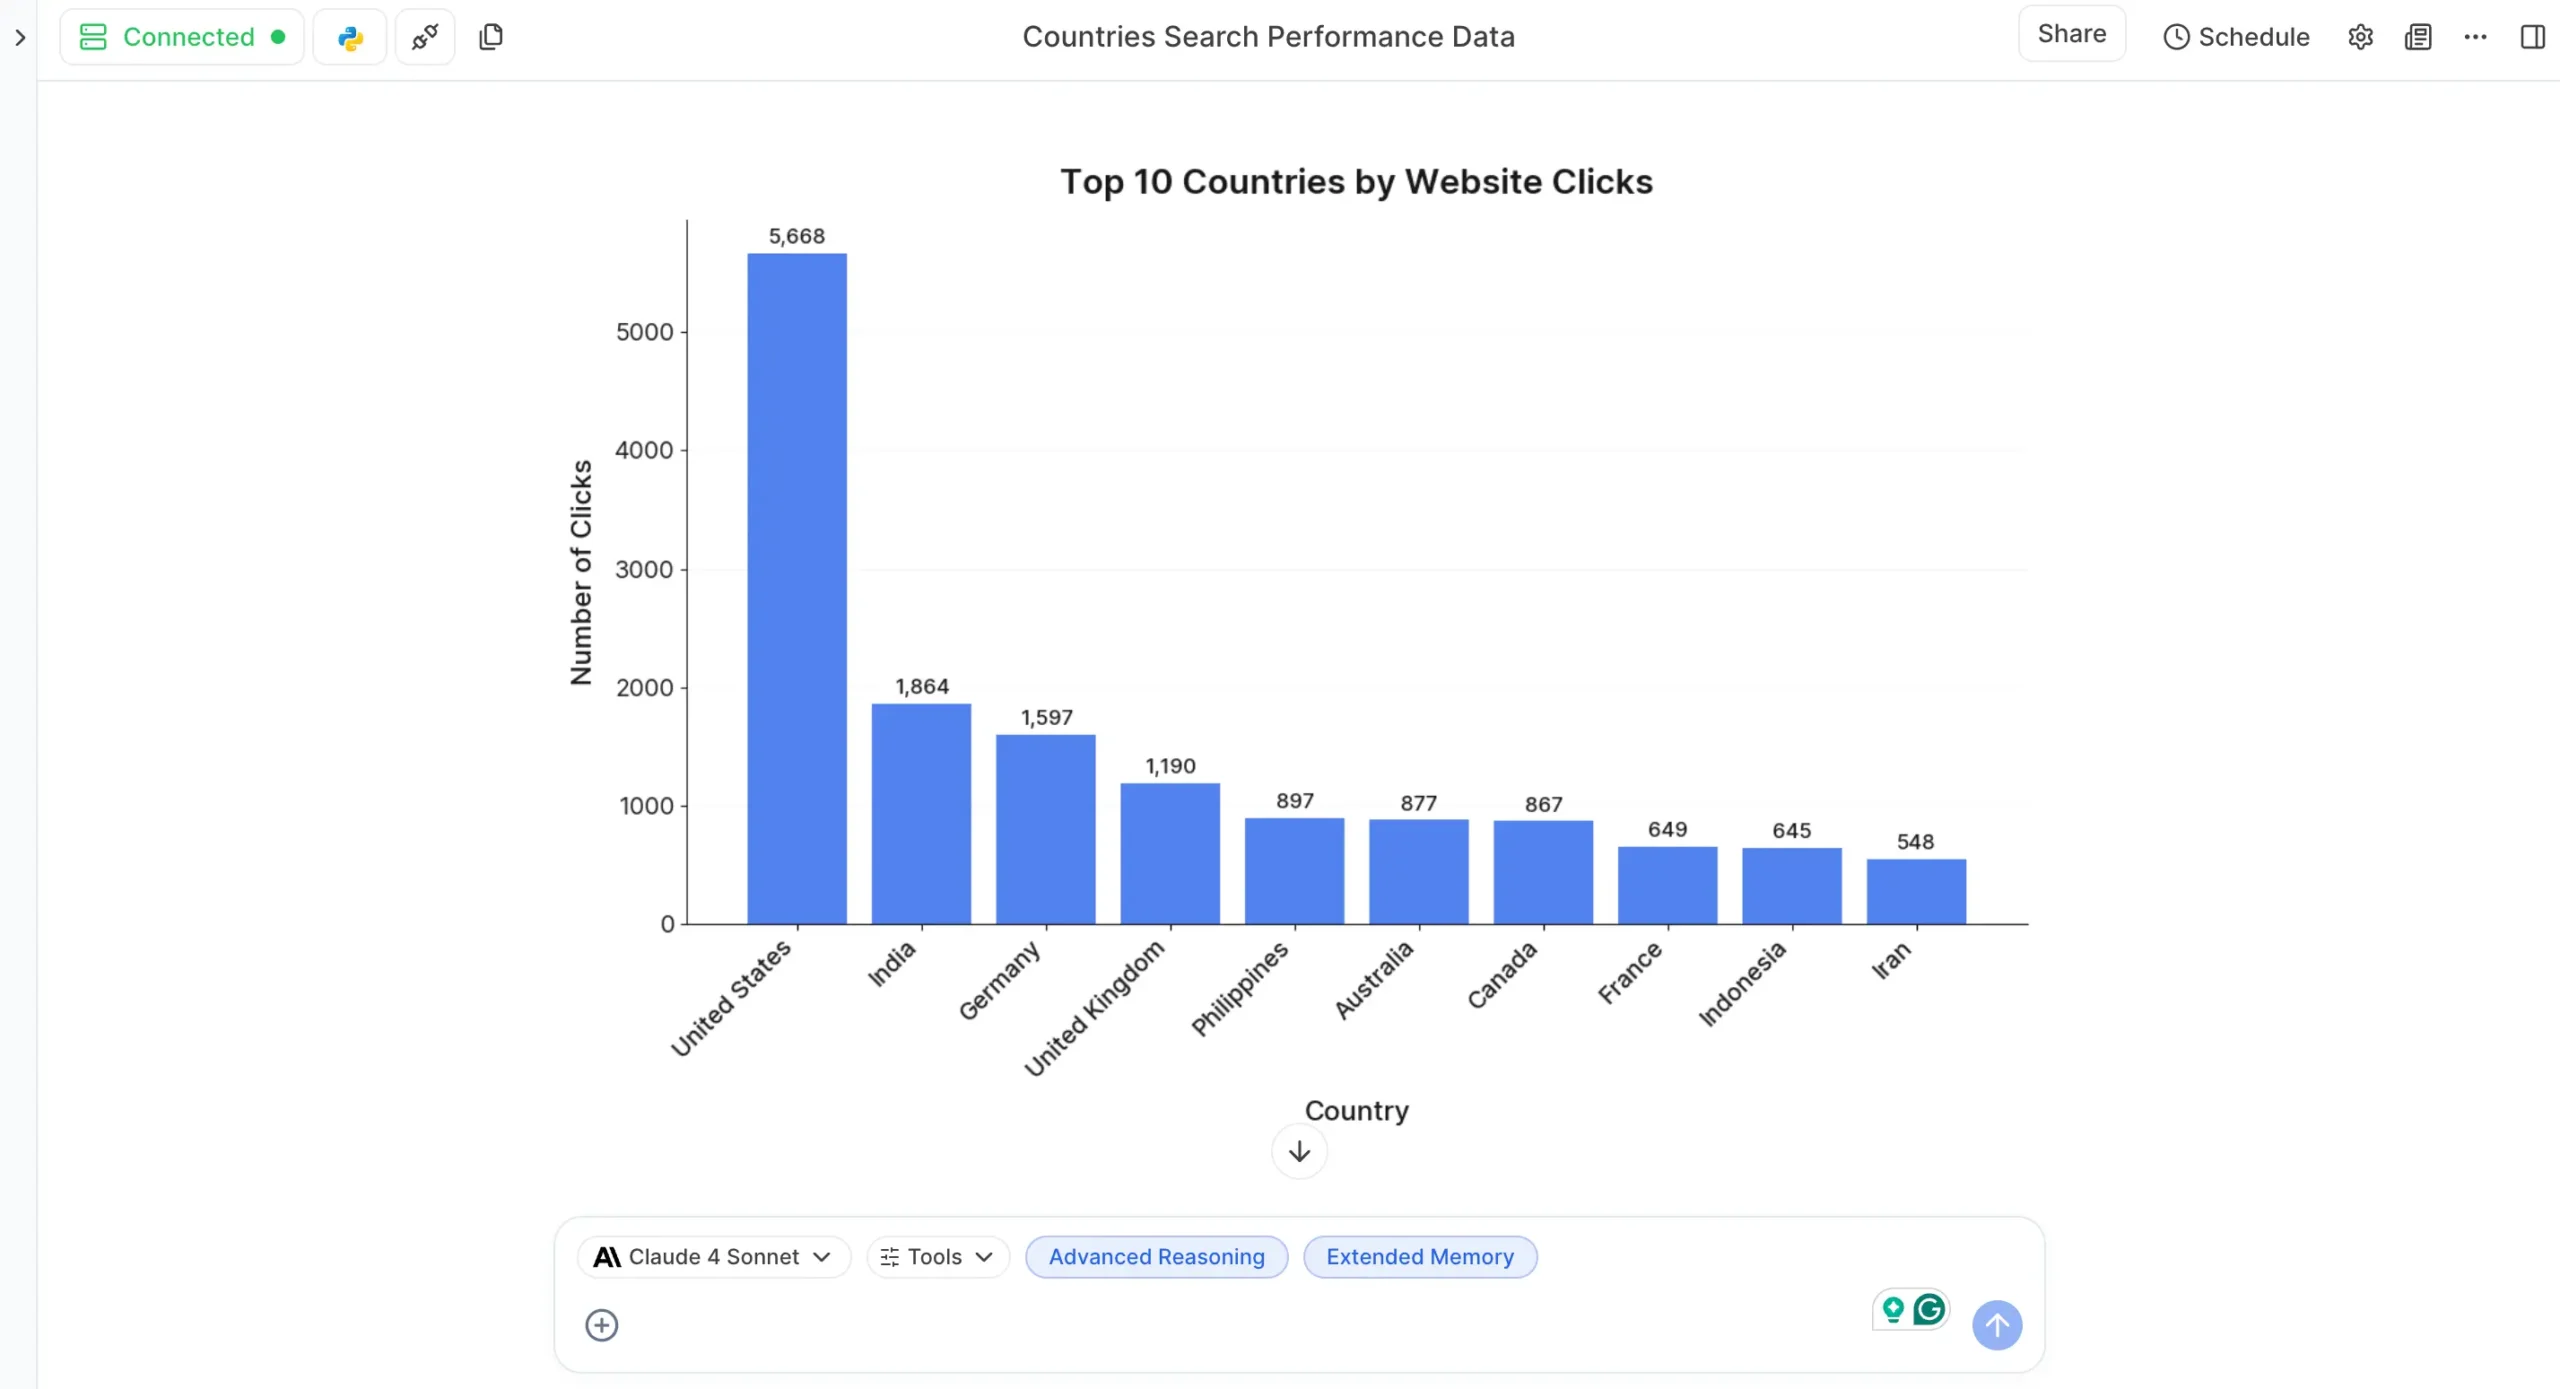
Boom. Graph ready to download.
Side note: You can edit some graphs directly. Look for the edit button next to the download button. Not all charts support this, but many do.
Let’s try something different – a pie chart showing the proportion of clicks from the top five countries.
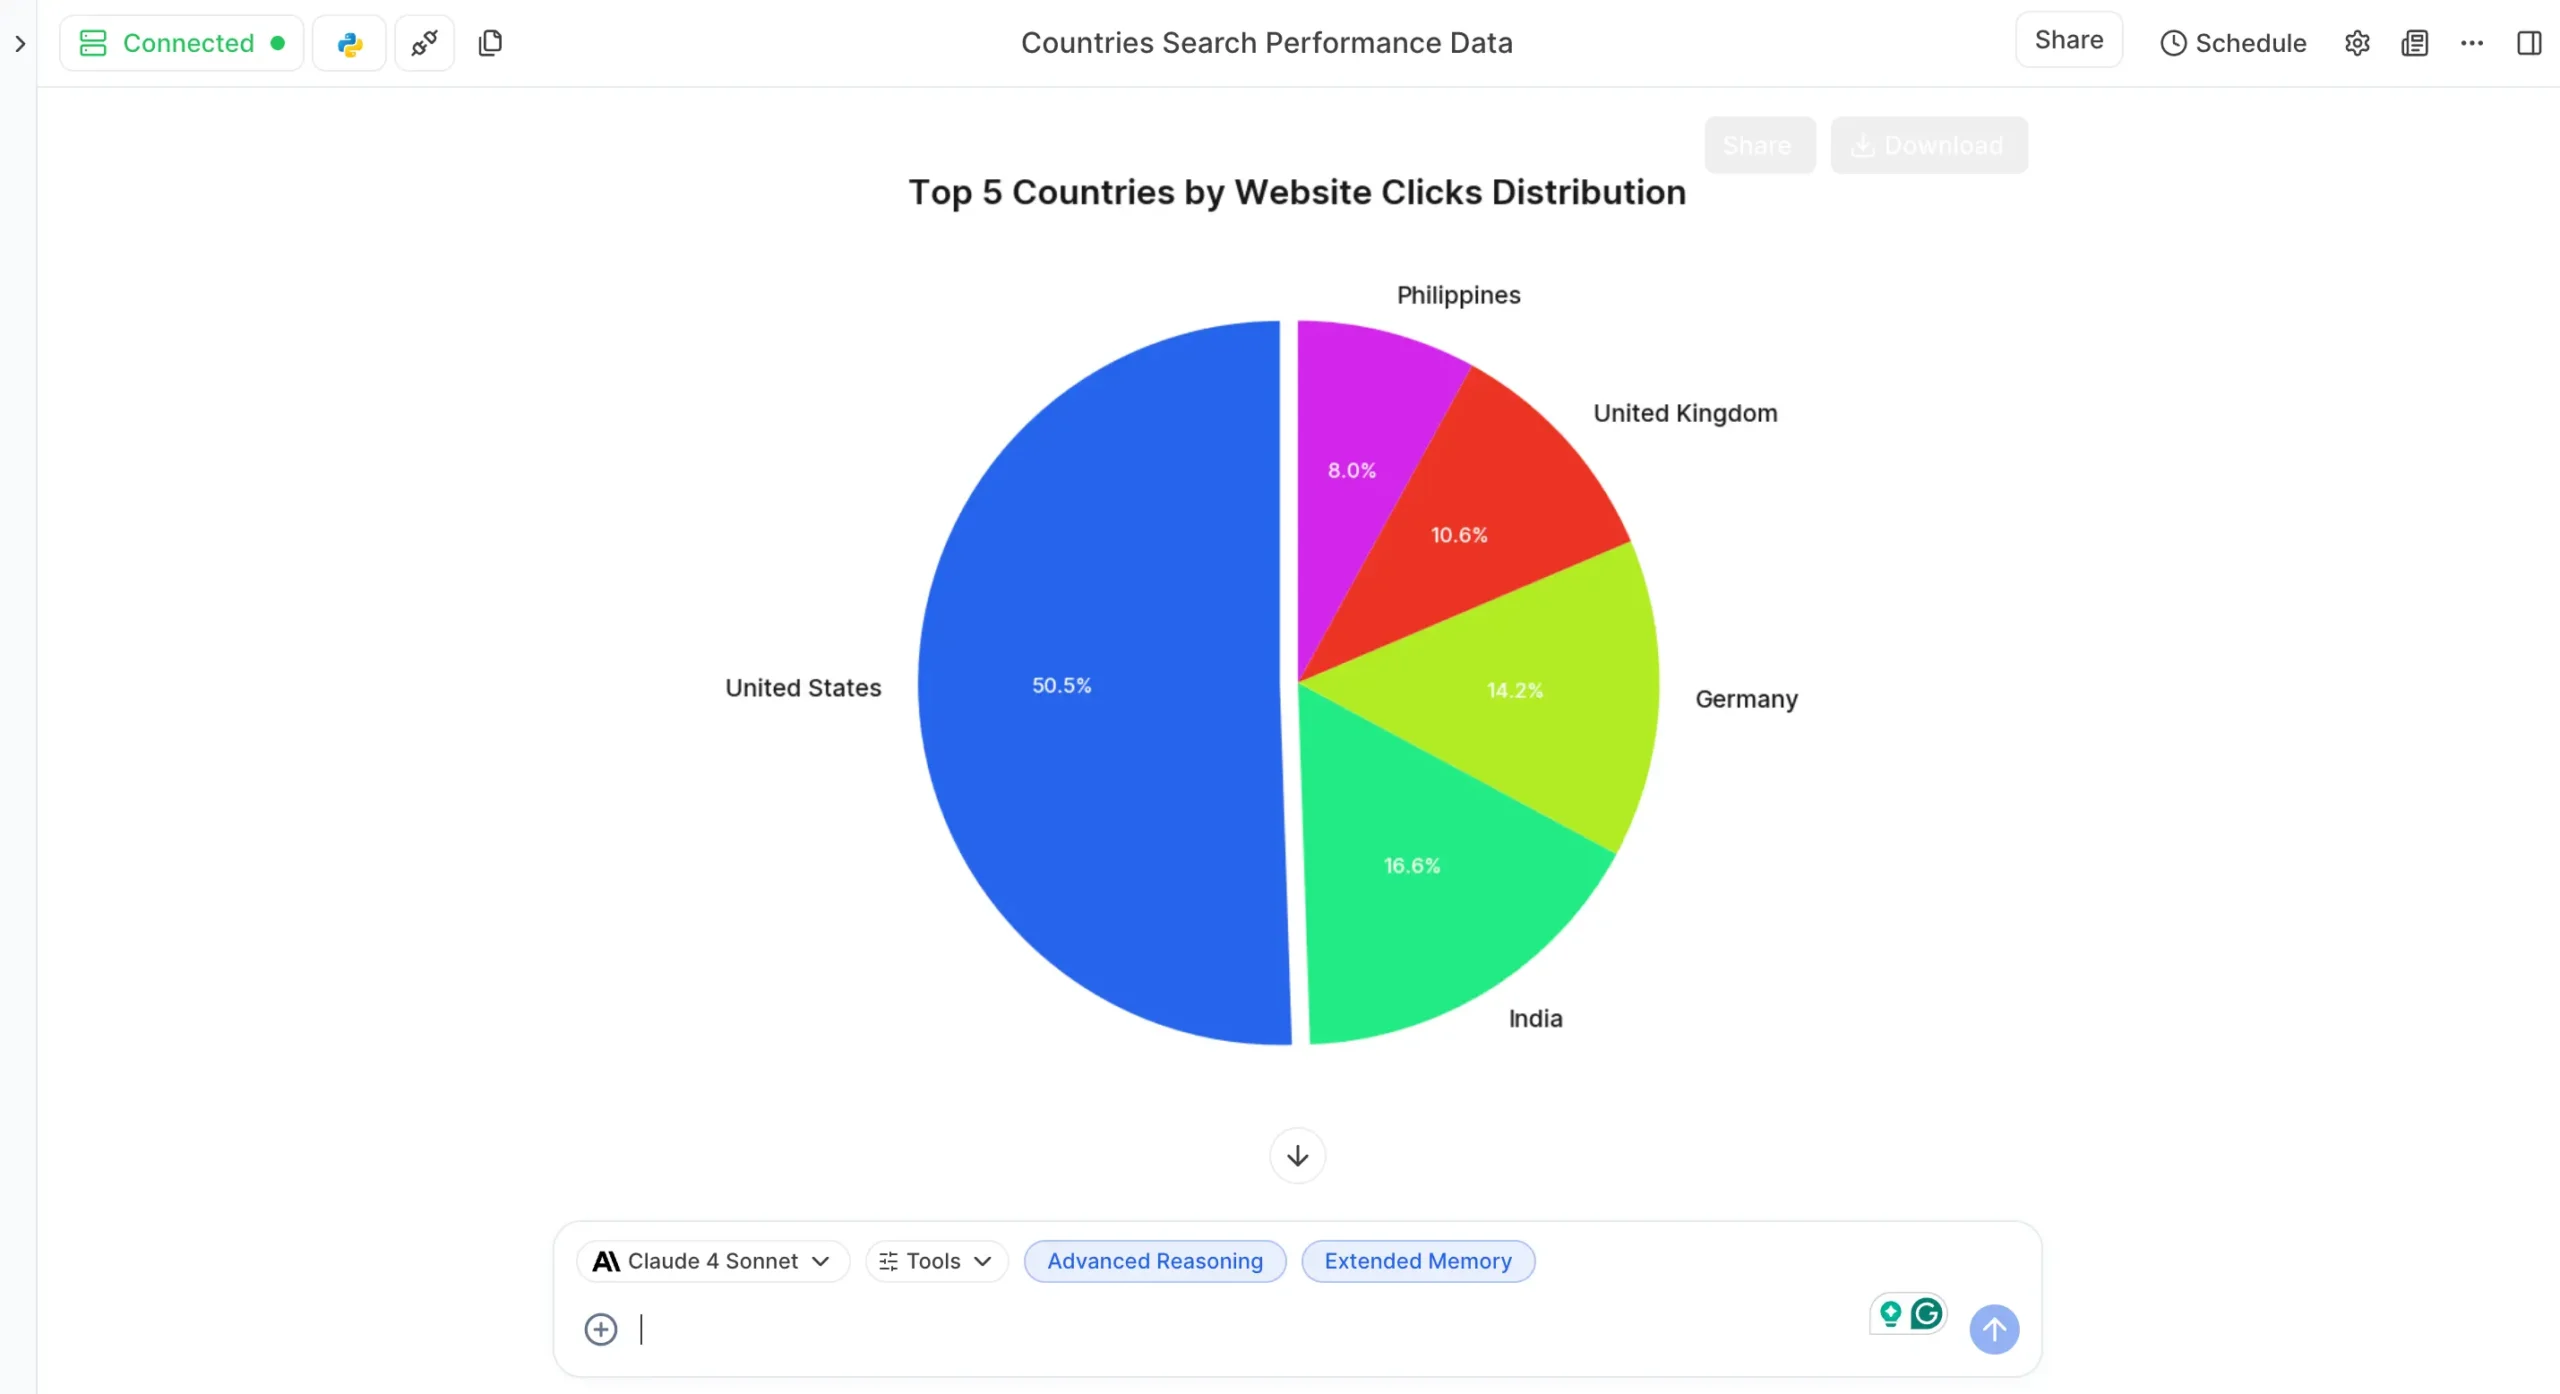
Perfect.
This is just scratching the surface. You can create any type of graph you want, and with the new theming system, they’ll look exactly how you need them.
Interactive Visualizations
Here’s where things get interesting. You can make your graphs interactive.
Just ask Julius to create an interactive version of whatever you want. For example: “Create an interactive 3D pie chart for the top five countries.”
Julius creates the interactive chart and gives you a download link.
The Interactive (Beta) theme makes these even more powerful, with enhanced hover effects and smoother animations.
Animated Visualizations
Want to animate your charts? Julius can do that too.
Ask for an animated version and Julius transforms static charts into high-quality downloadable GIFs.
These animated visualizations are perfect for presentations. They grab attention and make trends obvious.
Real-Time Updates with Data Connectors
Here’s something completely new: when you connect Julius to live databases via Data Connectors, your visualizations can update in real-time.
Connect to your PostgreSQL database, create a sales dashboard, and watch the charts update as new data comes in. No more manual exports and re-uploads.
Data visualization used to require specialized tools and technical knowledge. Julius AI democratizes it completely.
You describe what you want to see, Julius creates it. You want it to look different, Julius themes it. You want it interactive, Julius makes it interactive. You want it animated, Julius animates it.
The barrier between having data and understanding data just got a lot lower.
Academic Assistance
If you’re a student, teacher, or anywhere in between, Julius AI has become significantly more useful for academic work.
Julius is still a math wizard. It can solve complex problems in calculus, statistics, algebra, whatever you throw at it.
The best part?
It shows you the step-by-step solution in a clean, easy-to-read format. But now with the updated AI models (Claude 4 Sonnet, GPT-5), the explanations are clearer and more pedagogically sound.
Julius covers way more than just math.
Struggling with a programming concept? Julius walks you through it with examples.
Trying to understand machine learning algorithms? It breaks them down into digestible pieces.
Research Paper Analysis
Here’s where Julius really shines for academics: research paper analysis.
Upload PDFs of research papers and Julius can:
I uploaded three papers on climate change economics, and Julius created a comparative analysis highlighting where the studies agreed, disagreed, and what gaps existed.
This used to take me hours.
Literature Reviews Made Easy
Building literature reviews is now much faster. Upload multiple papers on your topic, and Julius can:
The new Data Explorer feature is crucial here. You can see exactly which papers contributed to each insight, ensuring proper attribution.
Collaboration Features
Share your academic Notes/Notebooks with collaborators. Everyone can see the same analysis steps, modify parameters, and track changes.
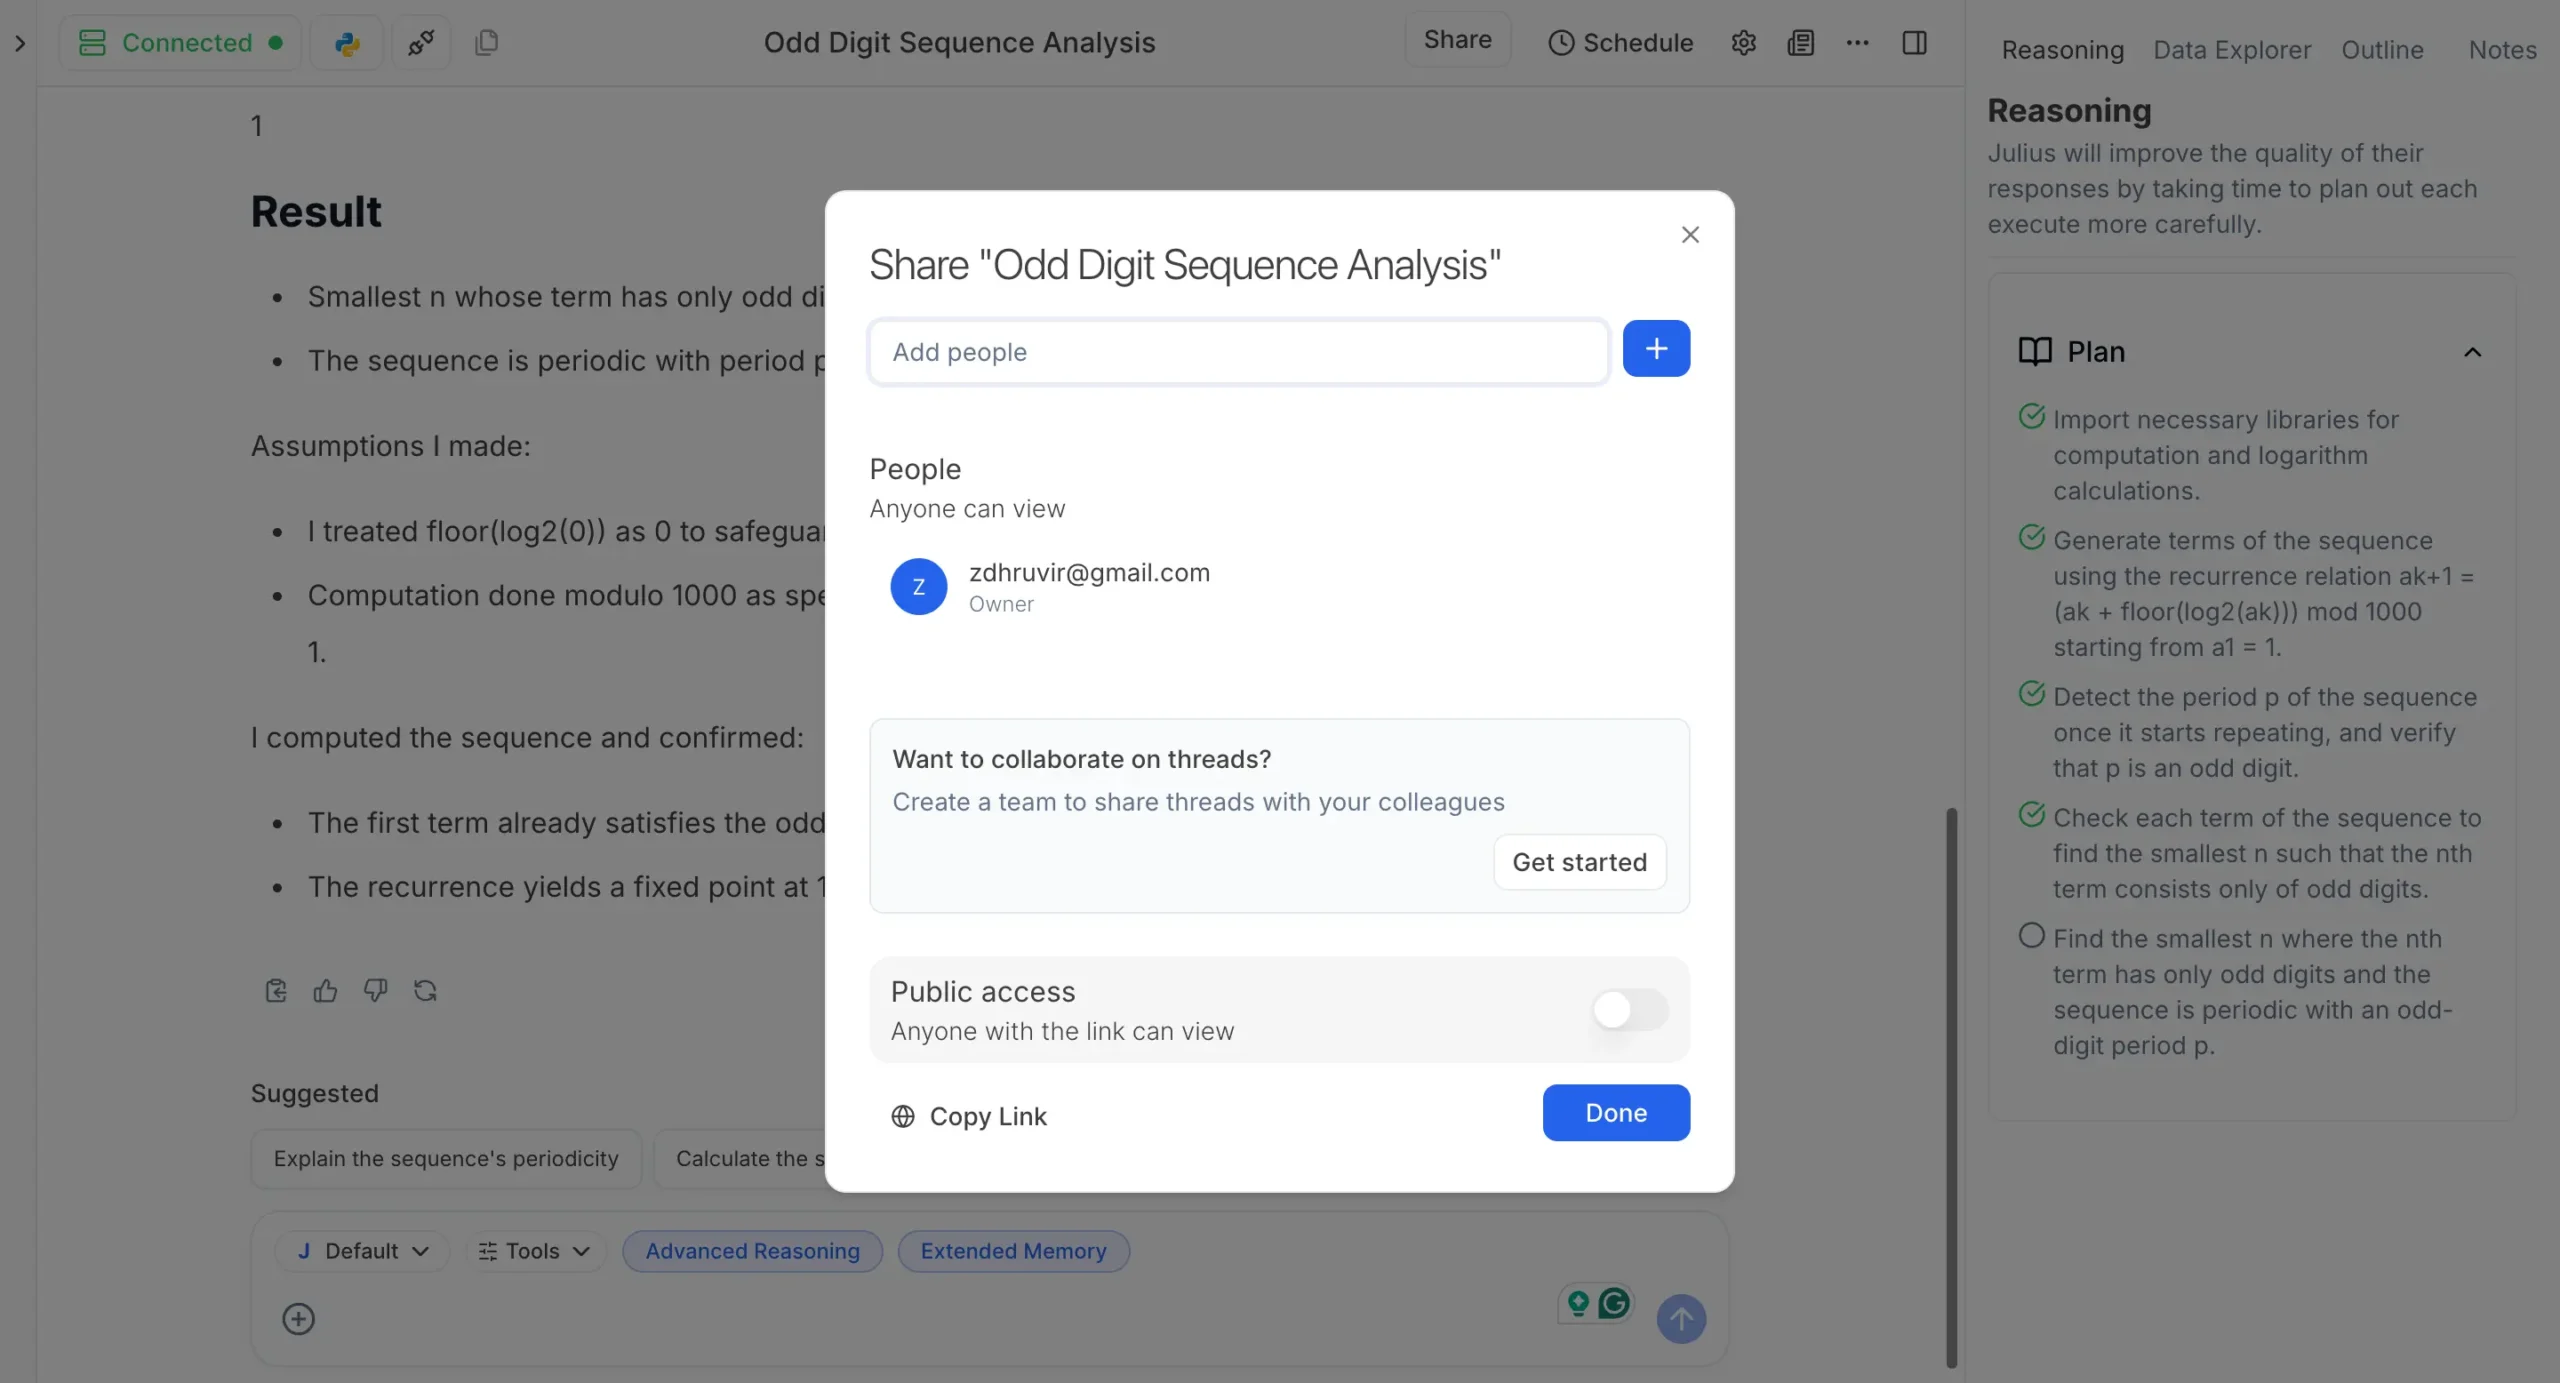
This is invaluable for research teams working on the same project.
Julius AI has evolved from a helpful homework assistant into a comprehensive academic research platform.
Notebooks and Notebook Templates
This is the biggest addition to Julius AI, and it changes everything about how you work with data.
Think of Notebooks as recipe books for data analysis. Instead of asking Julius the same questions every time you get new data, you build a Notebook once and reuse it forever.

How Notebooks Work
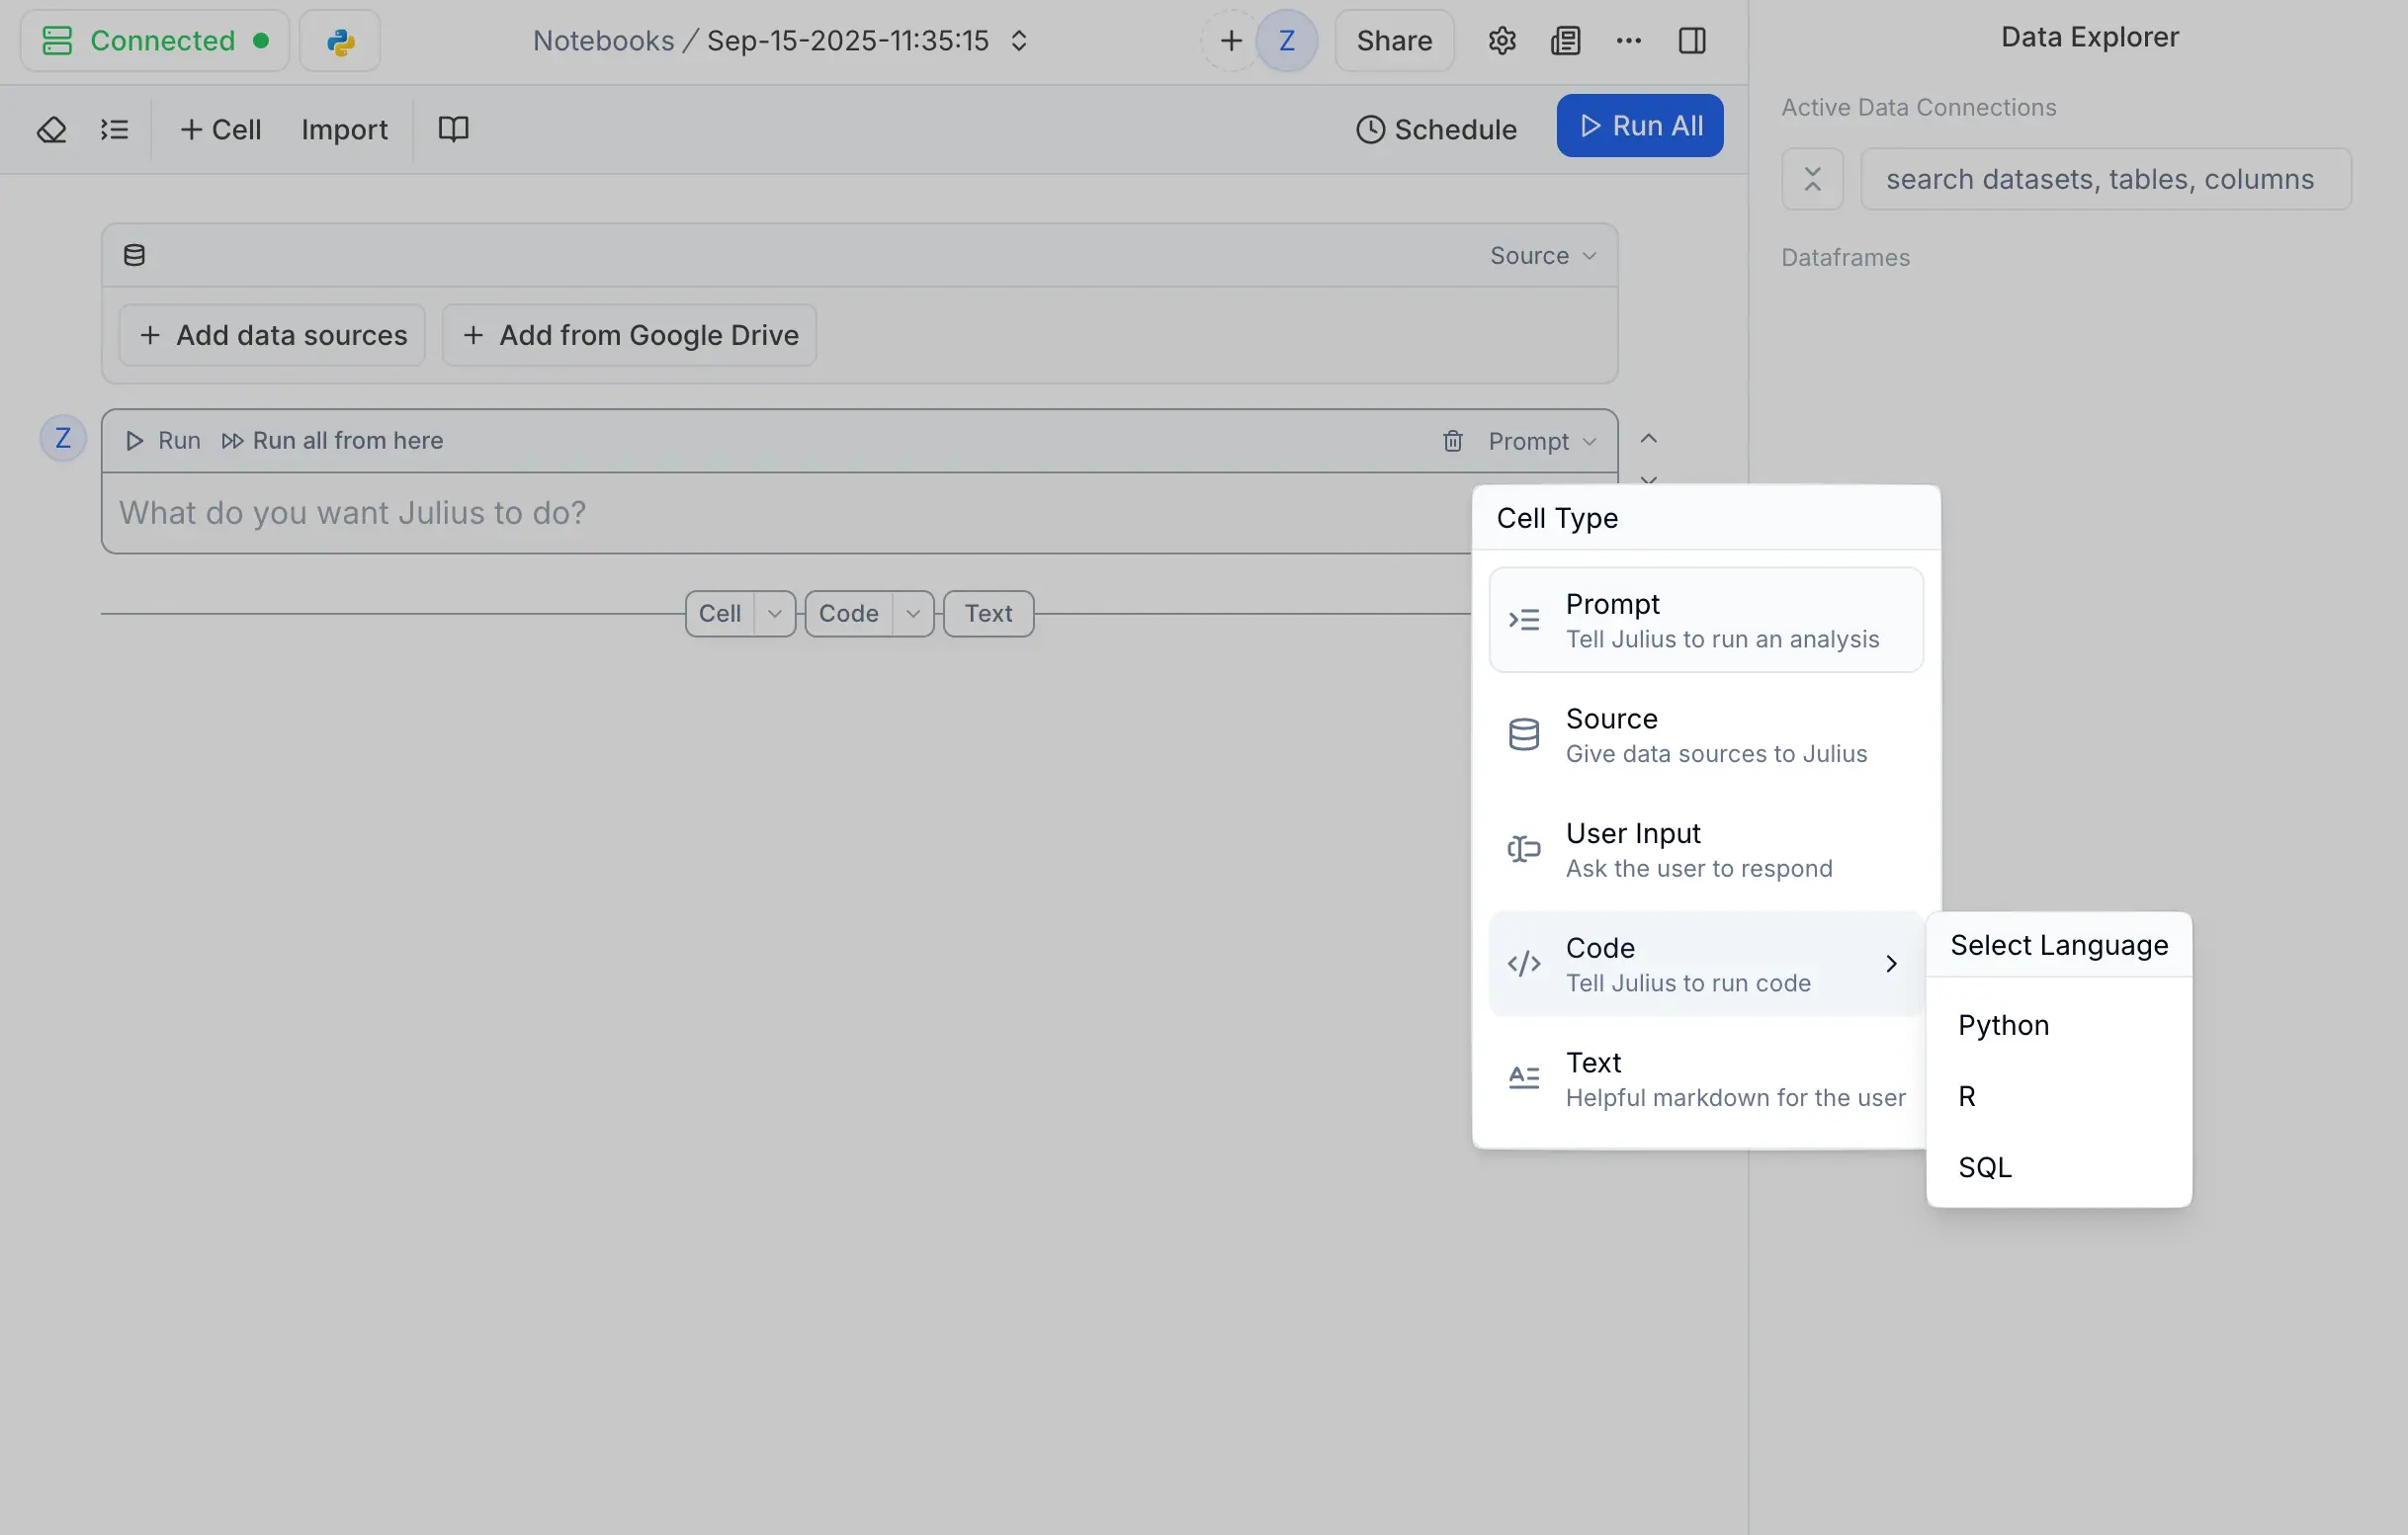
Notebooks consist of different cell types, each serving a specific purpose:
Here’s a real example: I built a sample website traffic analysis Notebook.
Cell 1 (File): Connects my Google Search Console data
Cell 2 (User Input): Asks what to analyze
Cell 3 (Prompt): “Create a summary with invaluable insights based on what you just analyzed”
Cell 4 (Prompt): “Generate charts showing top countries and traffic trends”
Cell 5 (Code): Exports results to a formatted PDF report
Notice how Notebook helps me control the output that I get and helps me reproduce parts or sum of that notebook, saving a lot of time.
Building Your First Notebook
Creating Notebooks is surprisingly intuitive.
You can:
- Start from scratch – Build your own step-by-step
- Copy existing Notebooks – From the template gallery
- Convert conversations – Turn any Julius chat into a reusable Notebook
Notebook Templates
Julius provides pre-built templates for common use cases:
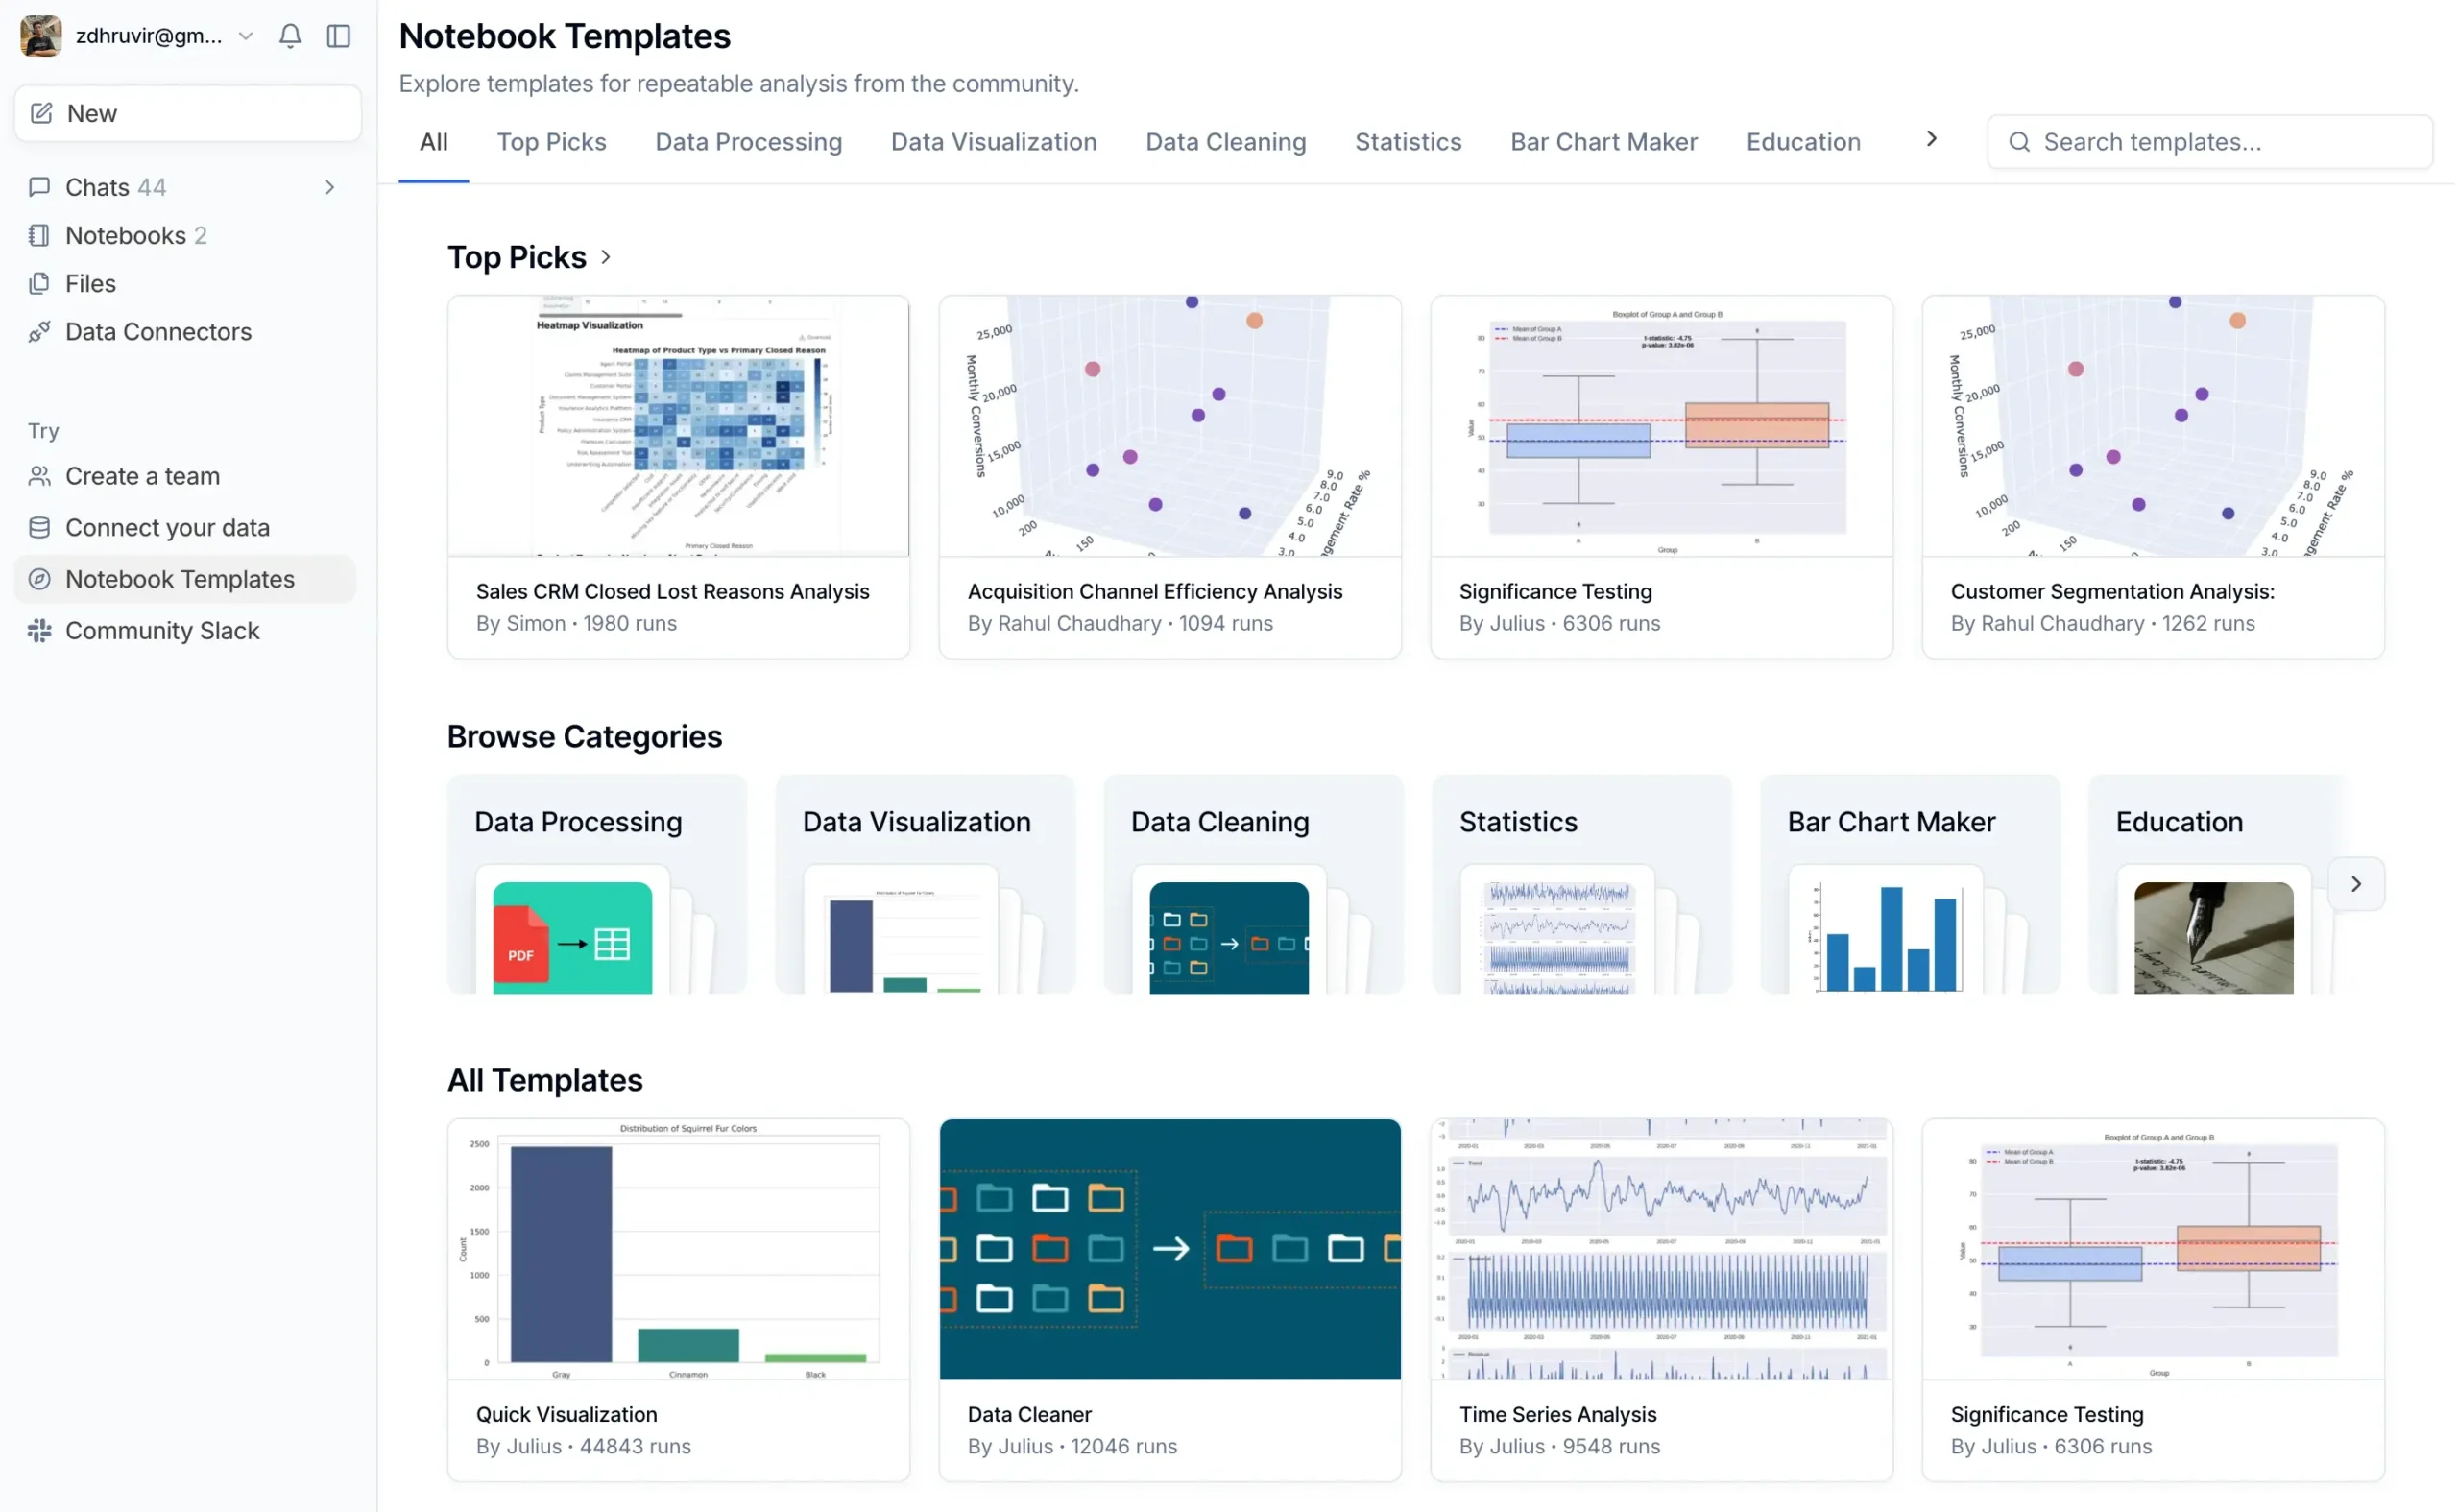
Each template has run thousands of times, so you know they work.
Pick one close to your needs and customize it.
Running Notebooks
Notebooks give you multiple execution options:
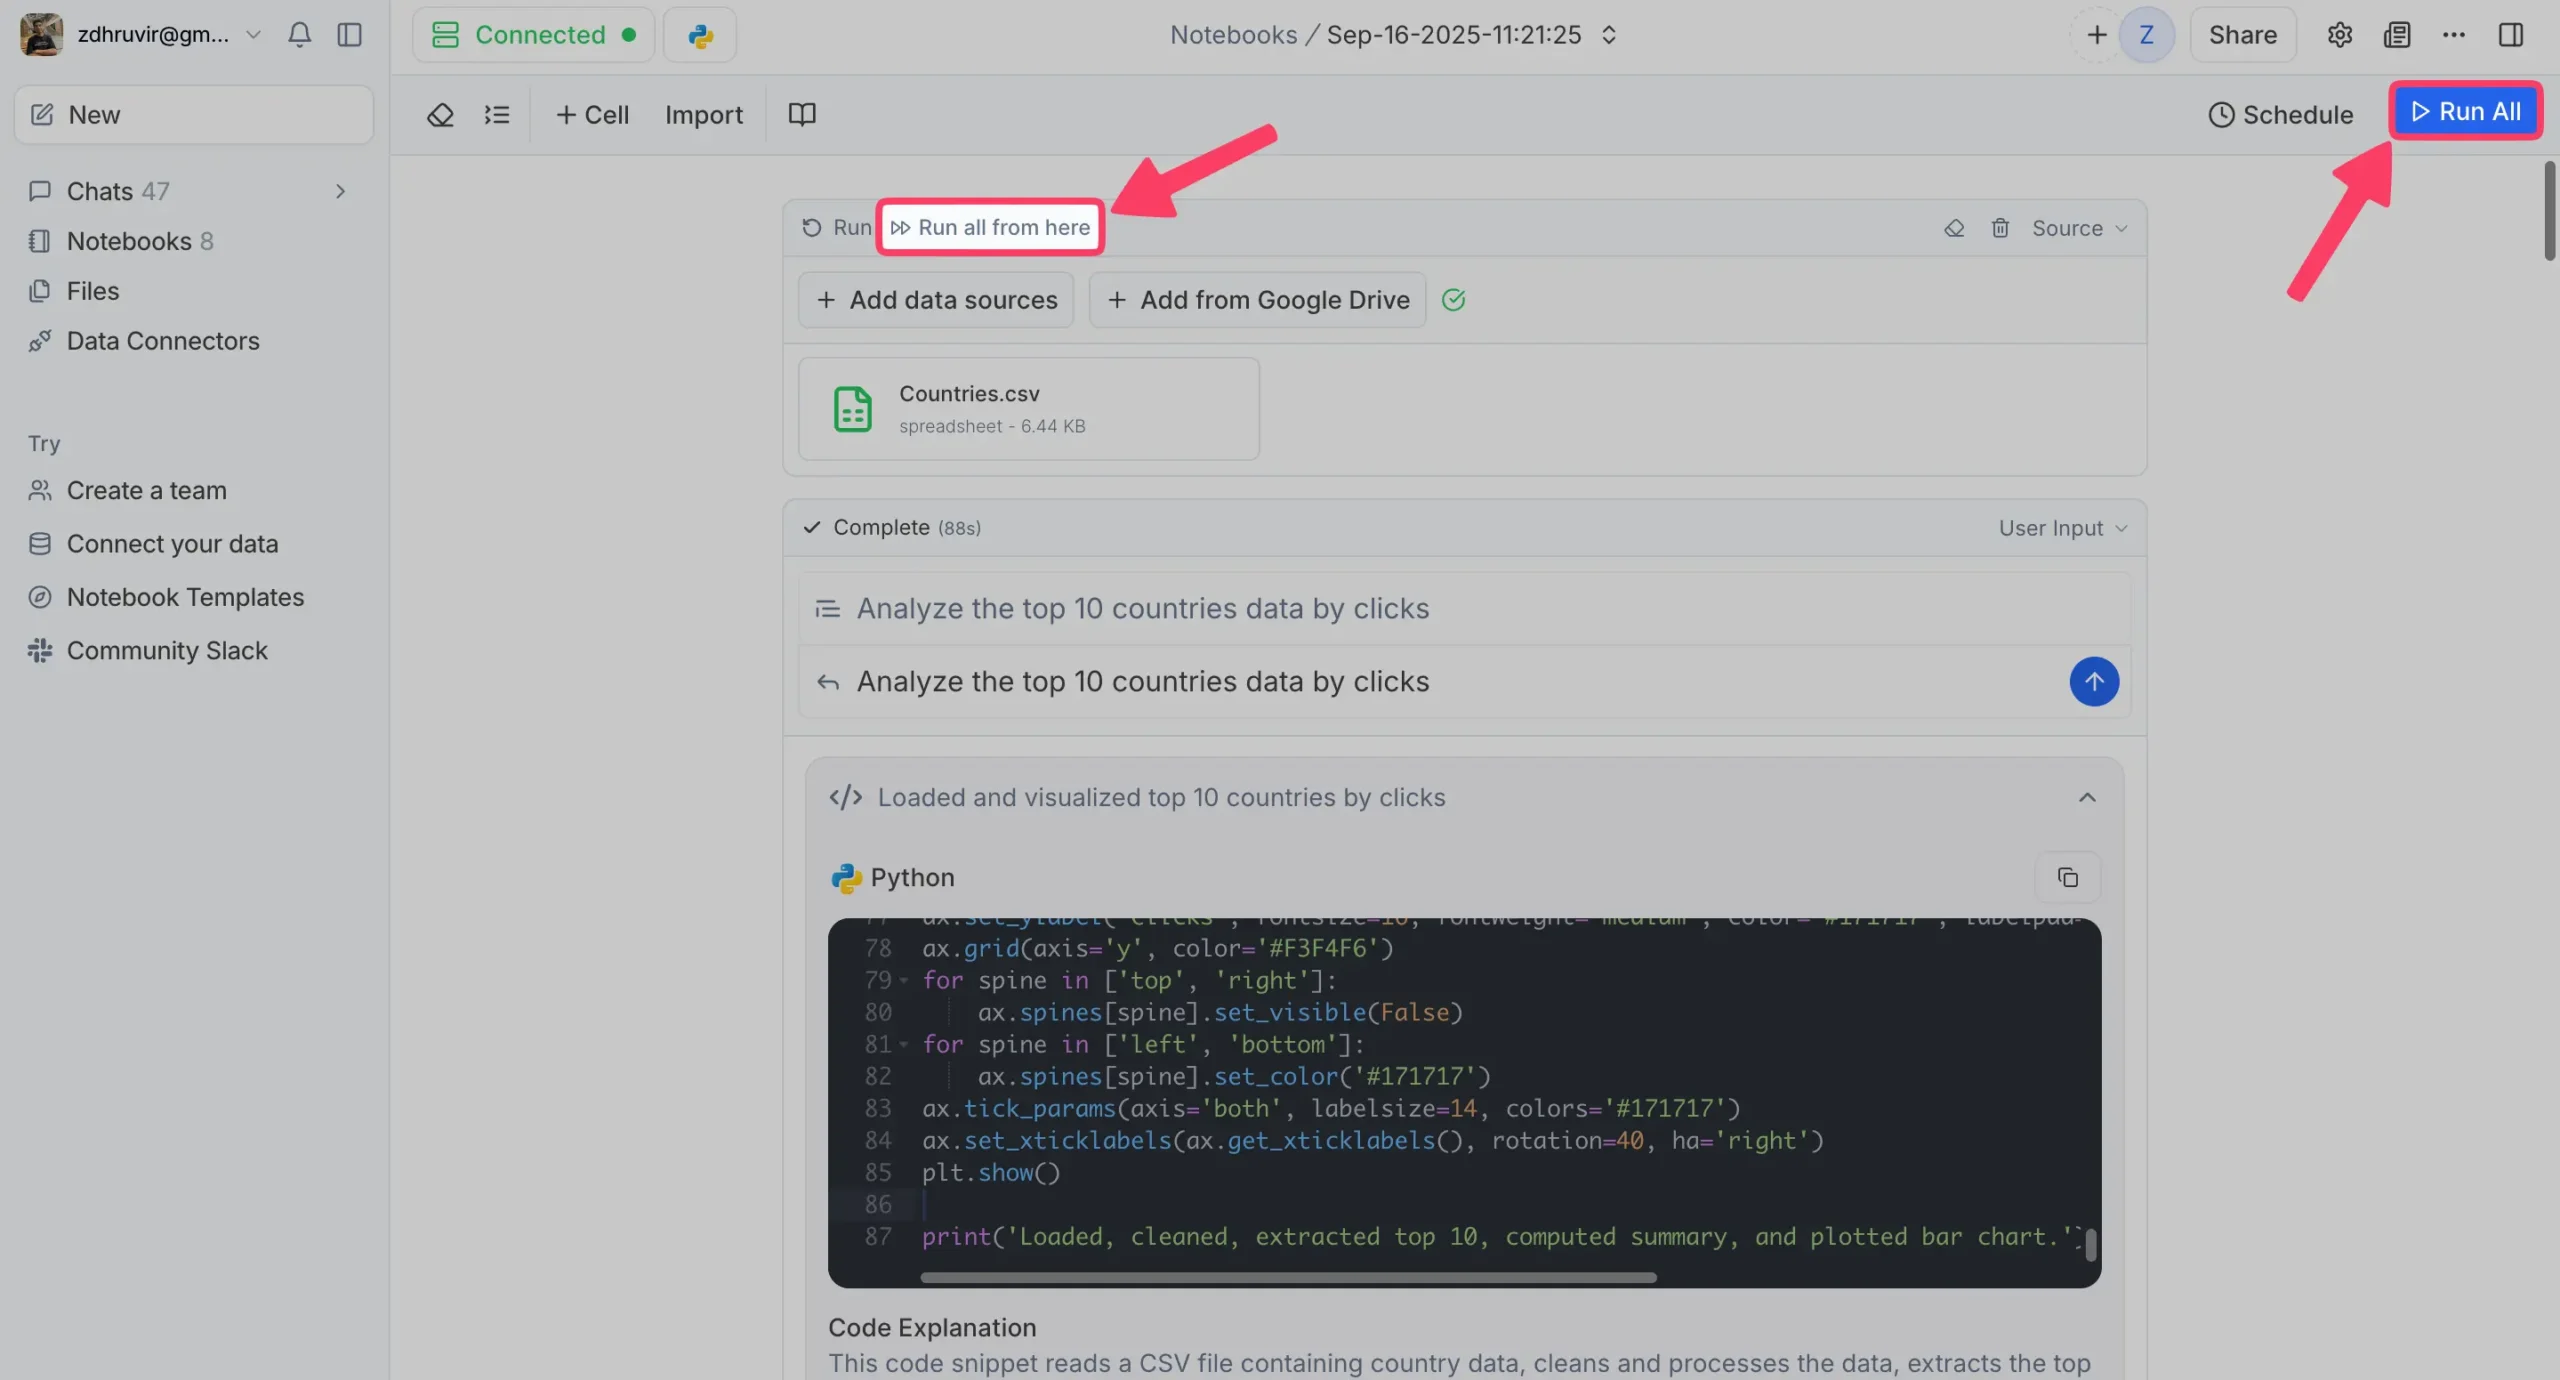
This flexibility is crucial when developing and testing your analysis.
Scheduling Notebooks
Here’s where Notebooks become really powerful: automation.
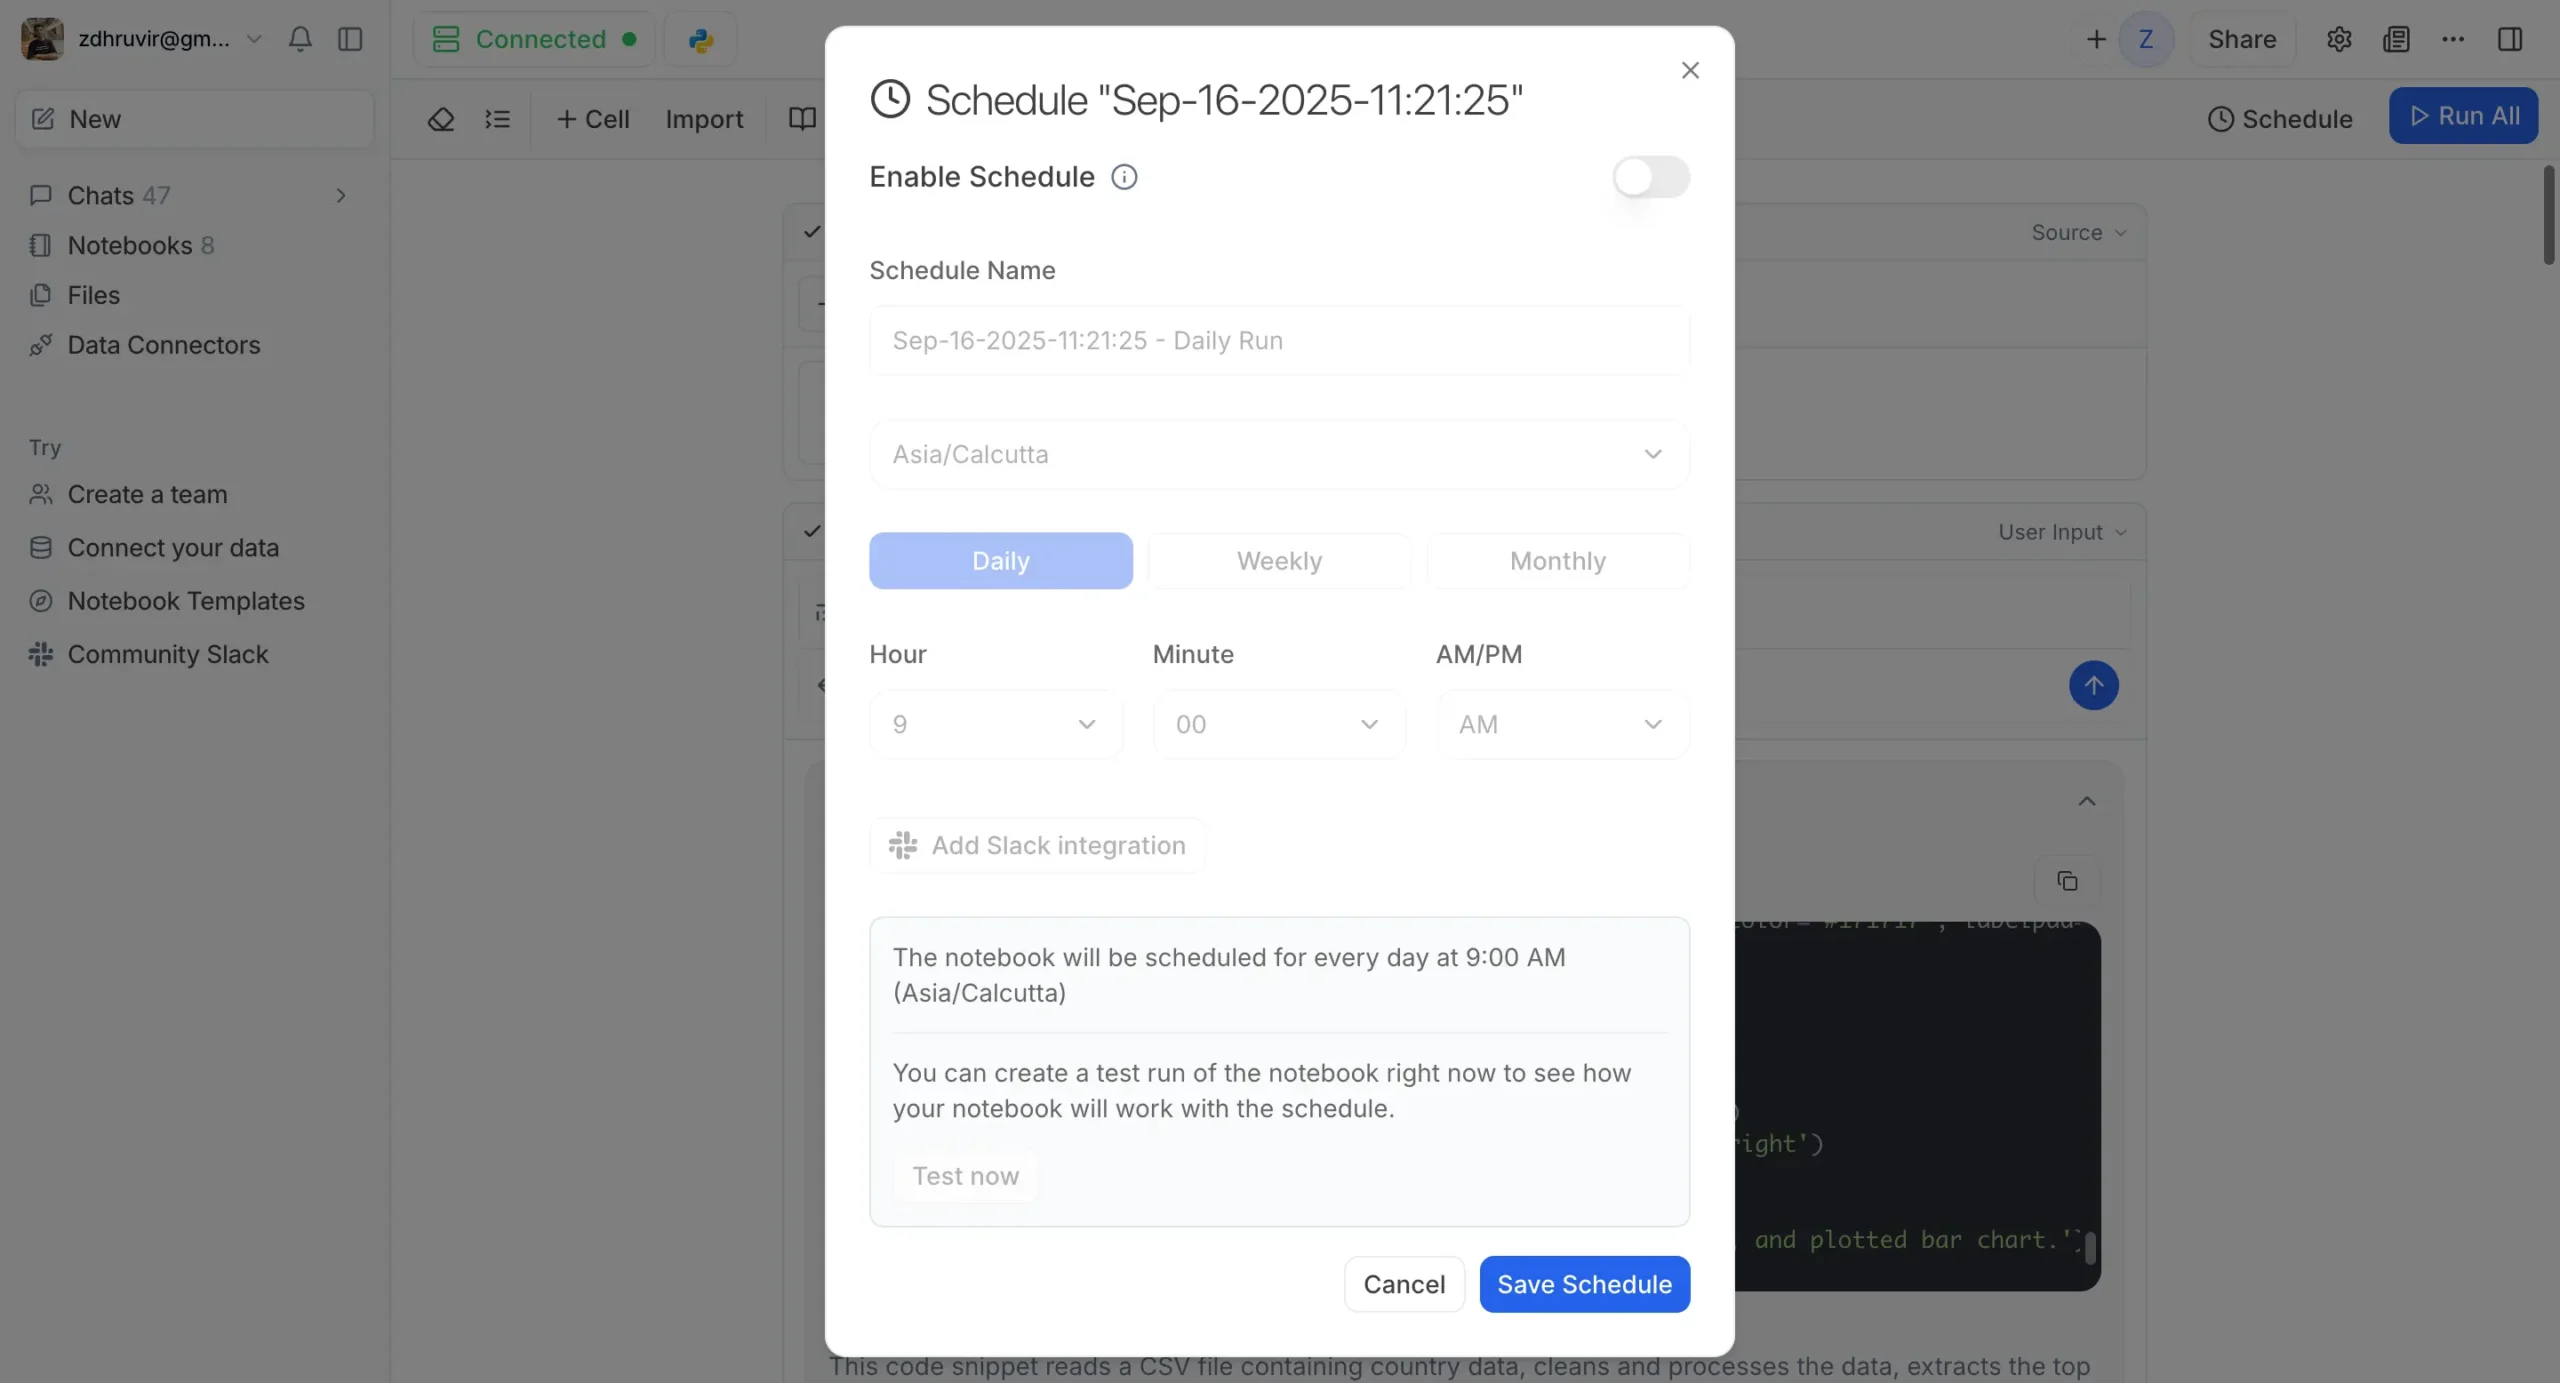
Set Notebooks to run automatically:
I have a Notebook that runs every Monday morning, analyzes the previous week’s website data, and emails me a summary. I never have to think about it.
Notebooks are designed for teamwork.
Share Notebooks with colleagues who can:
This is revolutionary for business teams. The data analyst builds the Notebook once, then marketing, sales, and executives can all run their own versions with their specific data.
Start simple. Pick a task you do regularly. Weekly reporting, monthly analysis, quarterly reviews.
Build it as a normal conversation with Julius first. Get it working exactly how you want. Then convert it to a Notebook.
Run it a few times to make sure it works consistently. Then set up scheduling if you want automation.
The learning curve is minimal because you’re just having conversations with Julius. The Notebook structure emerges naturally from how you already work.
Julius AI Pricing and Plans
The pricing structure has evolved with all the new features.
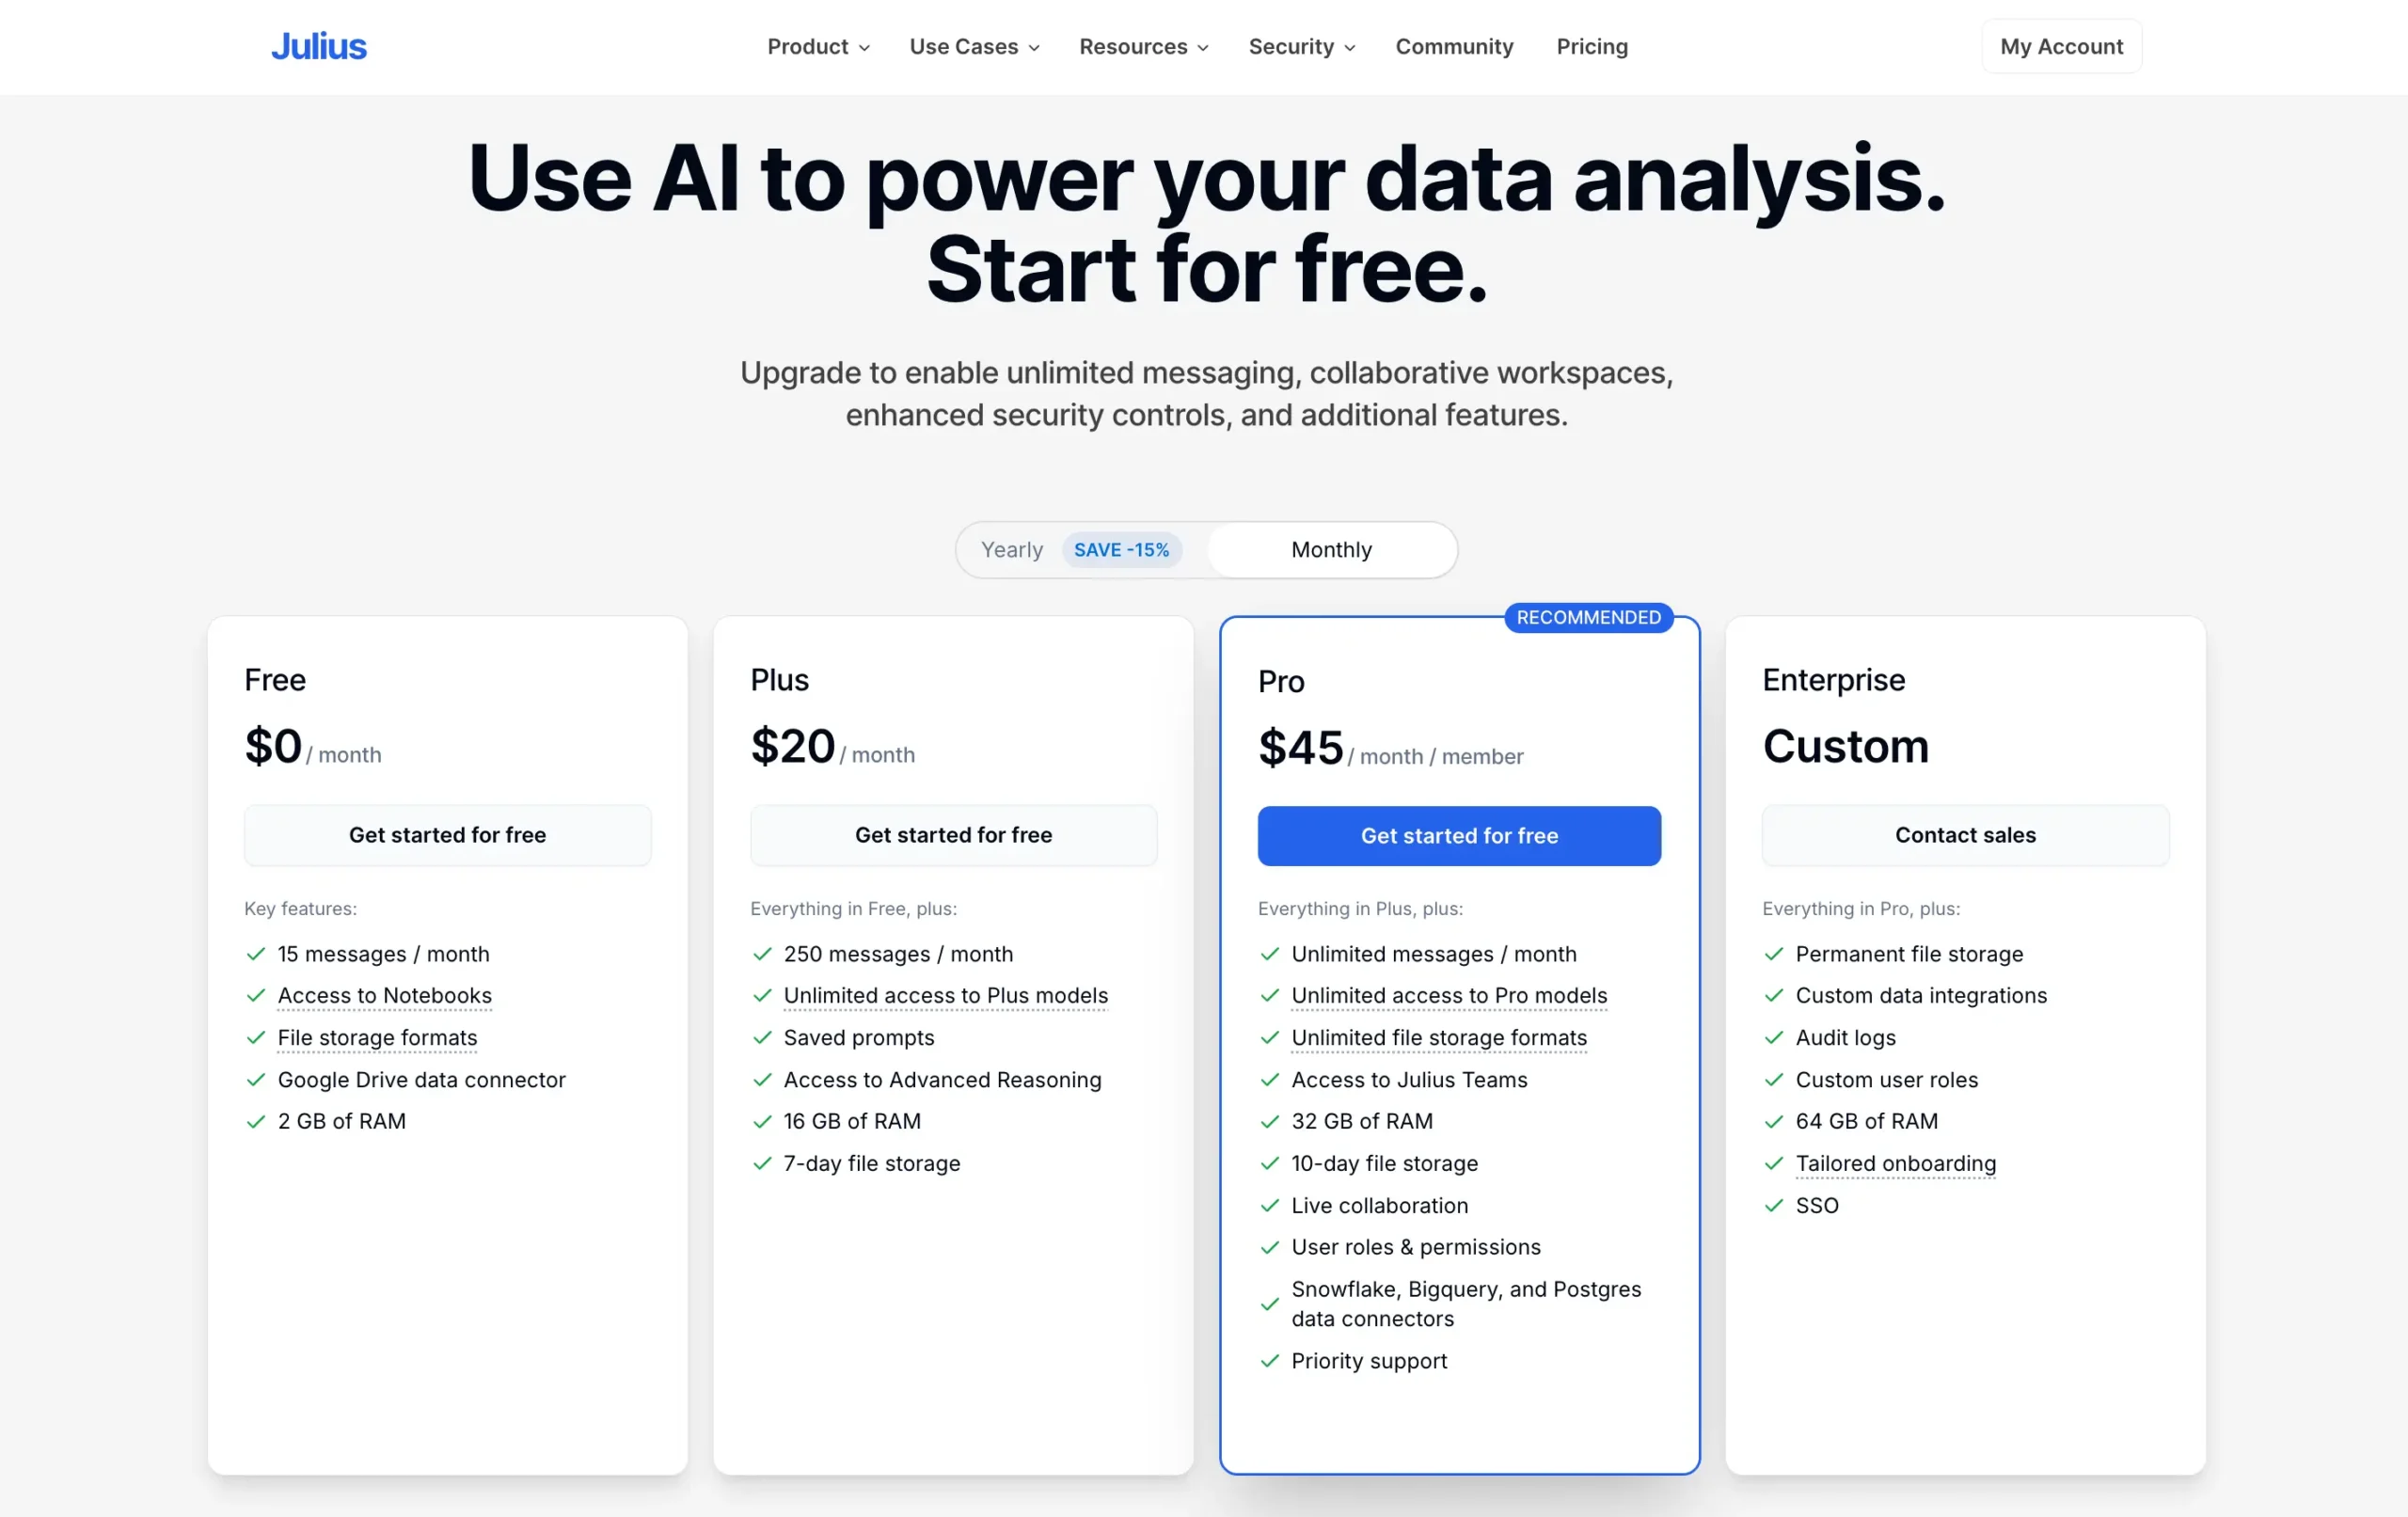
Free Plan ($0/month): 15 messages per month, basic Notebooks, Google Drive connector, 2 GB RAM. Enough to test the waters.
Plus Plan ($20/month): 250 messages, all Plus AI models, Advanced Reasoning, saved prompts, 16 GB RAM. Good for individual users doing regular analysis.
Pro Plan ($45/month): Unlimited messages, all Pro AI models, unlimited file storage, team collaboration, Data Connectors (PostgreSQL, BigQuery, Snowflake), 32 GB RAM. This is where the real power kicks in.
Enterprise (Custom pricing): Everything in Pro plus permanent file storage, custom integrations, audit logs, SSO, 64 GB RAM, tailored onboarding.
The sweet spot is Pro if you work with data regularly. Data Connectors alone justify the cost.
Plus works for casual users who want better AI models and some automation. Free is fine for testing, but you’ll hit the message limit quickly if you do any real analysis.
The annual discount saves 15% if you pay yearly plus the 10% flat discount that you can avail through my code DHRUVIR.
Final Thoughts and Recommendations
Julius AI has evolved from a chat-with-data tool into a complete data platform. You can now connect directly to databases, build reusable Notebooks, and automate reports.
If you work with data occasionally: Try the free plan. Upload files, test Chart Themes, see if the interface clicks.
If you analyze data regularly: The Pro plan ($45/month) is worth it. Data Connectors eliminate manual file management. Notebooks automate repetitive analysis.
If you’re technical: Julius amplifies your skills instead of replacing them. Build complex analysis in minutes, not hours.
Start simple. Pick one regular task – weekly reporting, monthly analysis, whatever. Build it as a conversation first, then convert to a Notebook. If it saves time, upgrade for full features.
Try the free plan. You’ll know in 15 minutes if it’s for you.
Disclosure: Our content is reader-supported. If you click on certain links we may make a commission.

Meet your guide
Dhruvir Zala
I help businesses and professionals stop wasting money on the wrong software. Most software reviews are just marketing in disguise. So I started writing the reviews I wish I had: thoroughly tested, brutally honest, and focused on what matters.
Julius AI
Try Julius AI completely free.
Your data has the answers. You just can’t get to them.
You’ve got a CSV with 10,000 rows. Your boss wants insights by EOD. You could spend 3 hours writing VLOOKUP formulas. Or you could upload it to Julius AI and just ask: “What are the top trends here?” It answers in 10 seconds. In plain English. No code. No formulas. Just the answer you needed.
Use code DHRUVIRCode copied! for 10% off after your free trial